
Exhibit c(ii)

– Highly Confidential; For Discussion Purposes Only – December 20, 2023 Discussion Materials for the Special Committee Project Hydro
– Highly Confidential; For Discussion Purposes Only – Disclaimer This presentation has been prepared by Centerview
Partners LLC (“Centerview”) for use solely by the Special Committee of the Board of Directors of HireRight Holdings
Corporation (“Hydro”, the “Company” or the “Special Committee”) in connection with its evaluation
of proposed strategic alternatives for Hydro and for no other purpose. The information contained herein is based upon information
supplied by or on behalf of Hydro and publicly available information, and portions of the information contained herein may be
based upon statements, estimates and forecasts provided by Hydro. Centerview has relied upon the accuracy and completeness of
the foregoing information, and has not assumed any responsibility for any independent verification of such information or for
any independent evaluation or appraisal of any of the assets or liabilities (contingent or otherwise) of Hydro or any other entity,
or concerning the solvency or fair value of Hydro or any other entity. The financial analysis in this presentation is complex
and is not necessarily susceptible to a partial analysis or summary description. In performing this financial analysis, Centerview
has considered the results of its analysis as a whole and did not necessarily attribute a particular weight to any particular
portion of the analysis considered. Furthermore, selecting any portion of Centerview’s analysis, without considering the
analysis as a whole, would create an incomplete view of the process underlying its financial analysis. Centerview may have deemed
various assumptions more or less probable than other assumptions, so the reference ranges resulting from any particular portion
of the analysis described above should not be taken to be Centerview’s view of the actual value of Hydro. These materials
and the information contained herein are confidential, were not prepared with a view toward public disclosure, and may not be
disclosed publicly or made available to third parties without the prior written consent of Centerview. These materials and any
other advice, written or oral, rendered by Centerview are intended solely for the benefit and use of the Special Committee of
the Board of Directors of Hydro (in its capacity as such) in its consideration of strategic alternatives, and are not for the
benefit of, and do not convey any rights or remedies for any holder of securities of Hydro or any other person. Centerview will
not be responsible for and has not provided any tax, accounting, actuarial, legal or other specialist advice. These materials
are not intended to provide the sole basis for evaluating strategic alternatives, and this presentation does not represent a fairness
opinion, recommendation, valuation or opinion of any kind, and is necessarily incomplete and should be viewed solely in conjunction
with the oral presentation provided by Centerview.
– Highly Confidential;
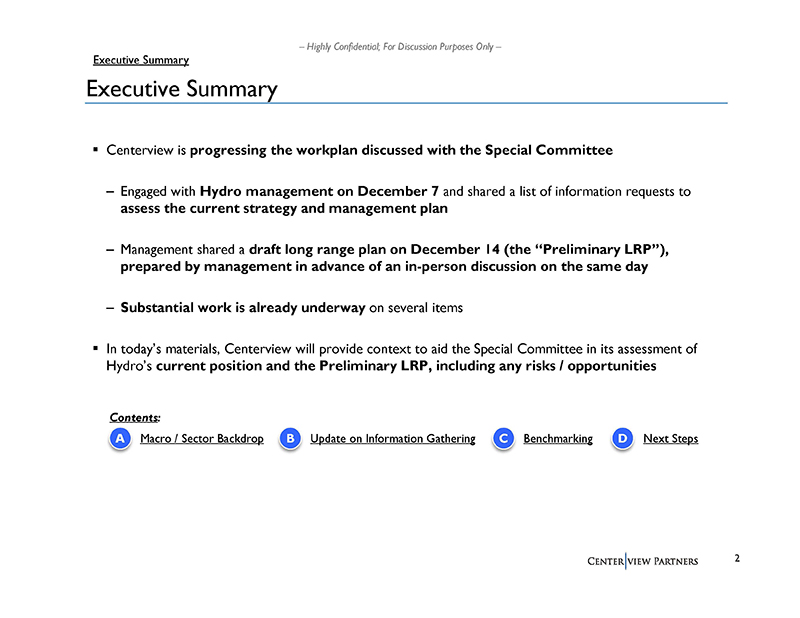
For Discussion Purposes Only – Executive Summary ▪ Centerview is progressing the workplan discussed with the Special
Committee – Engaged with Hydro management on December 7 and shared a list of information requests to assess the current
strategy and management plan – Management shared a draft long range plan on December 14 (the “Preliminary LRP”),
prepared by management in advance of an in-person discussion on the same day – Substantial work is already underway on several
items ▪ In today’s materials, Centerview will provide context to aid the Special Committee in its assessment of Hydro’s
current position and the Preliminary LRP, including any risks / opportunities A Macro / Sector Backdrop B Update on Information
Gathering C Benchmarking D Next Steps Contents: Executive Summary
– Highly Confidential;
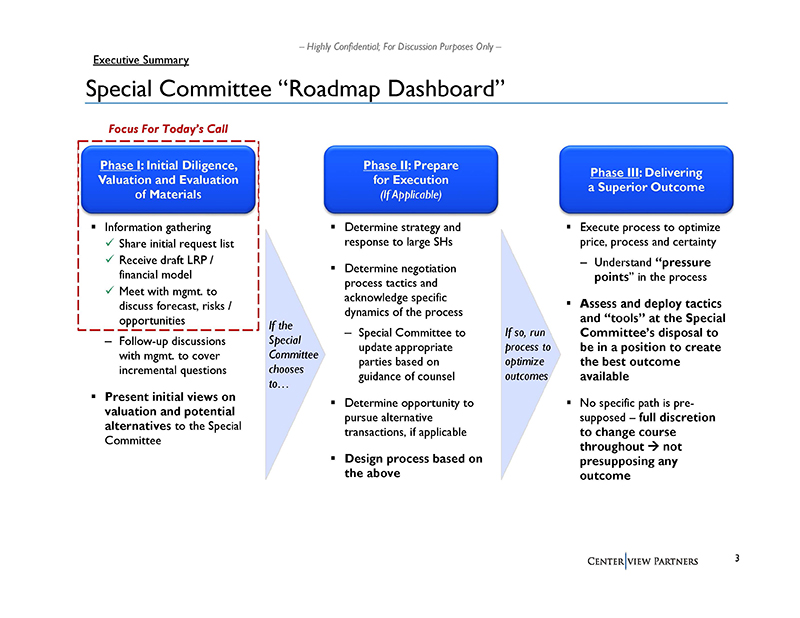
For Discussion Purposes Only – Special Committee “Roadmap Dashboard” ▪ Information gathering x Share initial
request list x Receive draft LRP / financial model x Meet with mgmt. to discuss forecast, risks / opportunities – Follow-up
discussions with mgmt. to cover incremental questions ▪ Present initial views on valuation and potential alternatives to
the Special Committee ▪ Determine strategy and response to large SHs ▪ Determine negotiation process tactics and acknowledge
specific dynamics of the process – Special Committee to update appropriate parties based on guidance of counsel ▪
Determine opportunity to pursue alternative transactions, if applicable ▪ Design process based on the above ▪ Execute
process to optimize price, process and certainty ‒ Understand “pressure points” in the process ▪ Assess
and deploy tactics and “tools” at the Special Committee’s disposal to be in a position to create the best outcome
available ▪ No specific path is presupposed – full discretion to change course throughout not presupposing any outcome
If the Special Committee chooses to… If so, run process to optimize outcomes Focus For Today’s Call Phase I: Initial
Diligence, Valuation and Evaluation of Materials Phase II: Prepare for Execution (If Applicable) Phase III: Delivering a Superior
Outcome Executive Summary
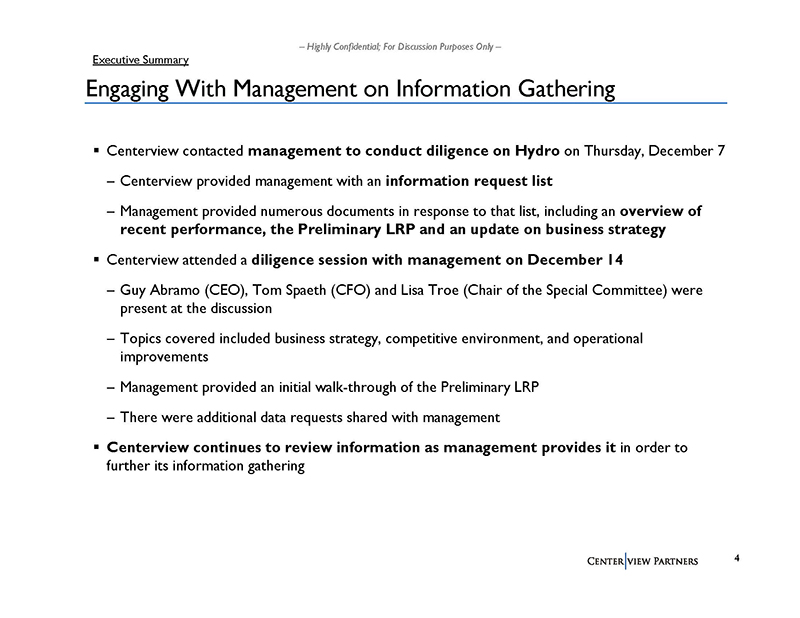
– Highly Confidential; For Discussion Purposes Only – ▪ Centerview contacted management to conduct diligence on Hydro on Thursday, December 7 – Centerview provided management with an information request list – Management provided numerous documents in response to that list, including an overview of recent performance, the Preliminary LRP and an update on business strategy ▪ Centerview attended a diligence session with management on December 14
– Guy Abramo
(CEO), Tom Spaeth (CFO) and Lisa Troe (Chair of the Special Committee) were present at the discussion – Topics covered included
business strategy, competitive environment, and operational improvements – Management provided an initial walk-through of
the Preliminary LRP – There were additional data requests shared with management ▪ Centerview continues to review
information as management provides it in order to further its information gathering Engaging With Management on Information Gathering
Executive Summary
– Highly Confidential;
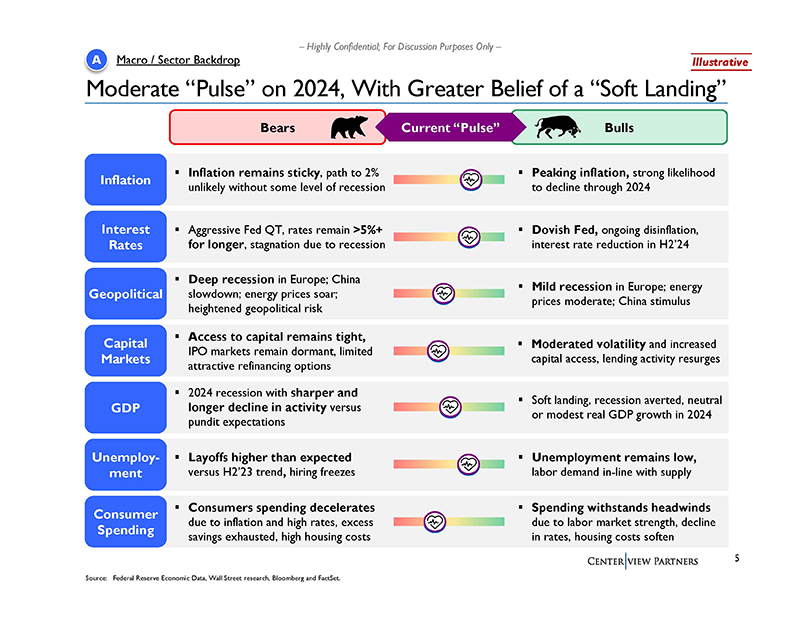
For Discussion Purposes Only – Moderate “Pulse” on 2024, With Greater Belief of a “Soft Landing”
A Macro / Sector Backdrop Bears Current “Pulse” Bulls Inflation ▪ Inflation remains sticky, path to 2% unlikely
without some level of recession ▪ Peaking inflation, strong likelihood to decline through 2024 Interest Rates ▪ Aggressive
Fed QT, rates remain >5%+ for longer, stagnation due to recession ▪ Dovish Fed, ongoing disinflation, interest rate reduction
in H2’24 Geopolitical ▪ Deep recession in Europe; China slowdown; energy prices soar; heightened geopolitical risk
▪ Mild recession in Europe; energy prices moderate; China stimulus Capital Markets ▪ Access to capital remains tight,
IPO markets remain dormant, limited attractive refinancing options ▪ Moderated volatility and increased capital access,
lending activity resurges GDP ▪ 2024 recession with sharper and longer decline in activity versus pundit expectations ▪
Soft landing, recession averted, neutral or modest real GDP growth in 2024 Unemployment ▪ Layoffs higher than expected versus
H2’23 trend, hiring freezes ▪ Unemployment remains low, labor demand in-line with supply Consumer Spending ▪
Consumers spending decelerates due to inflation and high rates, excess savings exhausted, high housing costs ▪ Spending
withstands headwinds due to labor market strength, decline in rates, housing costs soften Source: Federal Reserve Economic Data,
Wall Street research, Bloomberg and FactSet. Illustrative
– Highly Confidential;
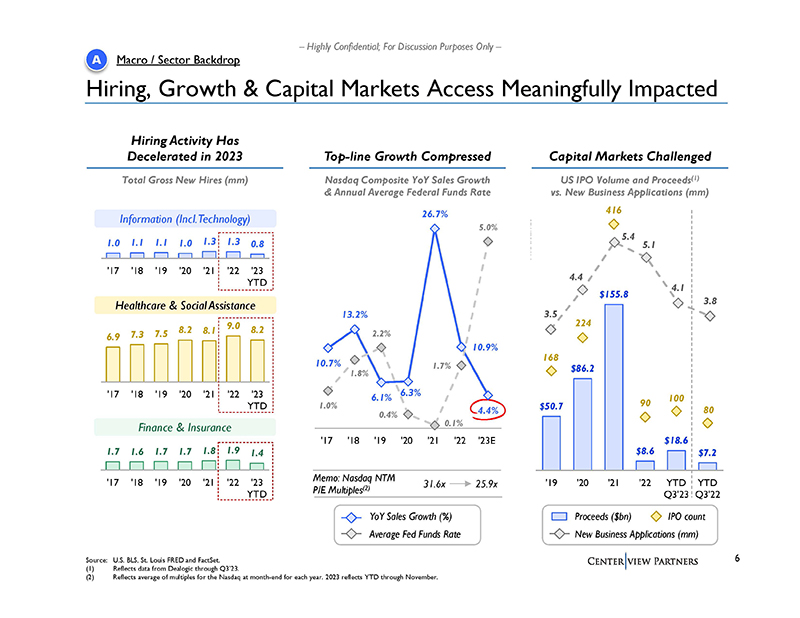
For Discussion Purposes Only – 3.5 4.4 5.4 5.1 4.1 3.8 Thousands $50.7 $86.2 $155.8 $8.6 $18.6 $7.2 168 224 416 90 100 80
'19 '20 '21 '22 YTD Q3'23 YTD Q3'22 Hiring, Growth & Capital Markets Access Meaningfully Impacted A Macro / Sector Backdrop
Source: U.S. BLS, St. Louis FRED and FactSet. (1) Reflects data from Dealogic through Q3’23. (2) Reflects average of multiples
for the Nasdaq at month-end for each year. 2023 reflects YTD through November. Top-line Growth Compressed Nasdaq Composite YoY
Sales Growth & Annual Average Federal Funds Rate Capital Markets Challenged US IPO Volume and Proceeds(1) vs. New Business
Applications (mm) Hiring Activity Has Decelerated in 2023 6.9 7.3 7.5 8.2 8.1 9.0 8.2 '17 '18 '19 '20 '21 '22 '23 YTD 1.0 1.1
1.1 1.0 1.3 1.3 0.8 '17 '18 '19 '20 '21 '22 '23 YTD Total Gross New Hires (mm) Proceeds ($bn) IPO count New Business Applications
(mm) Healthcare & Social Assistance Information (Incl. Technology) 1.7 1.6 1.7 1.7 1.8 1.9 1.4 '17 '18 '19 '20 '21 '22 '23
YTD Finance & Insurance YoY Sales Growth (%) Average Fed Funds Rate Memo: Nasdaq NTM P/E Multiples(2) 31.6x 25.9x 10.7% 13.2%
6.1% 6.3% 26.7% 10.9% 1.0% 4.4% 1.8% 2.2% 0.4% 0.1% 1.7% 5.0% '17 '18 '19 '20 '21 '22 '23E
– Highly Confidential;
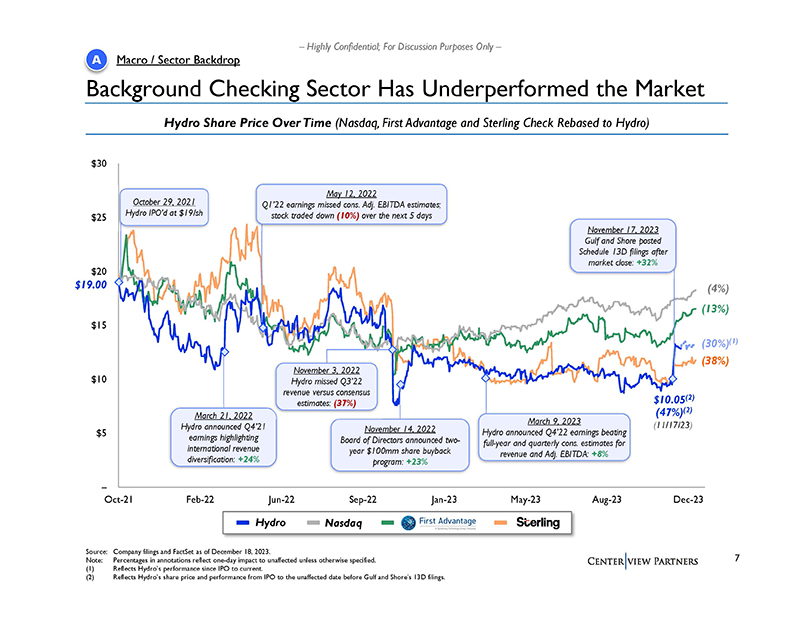
For Discussion Purposes Only – – $5 $10 $15 $20 $25 $30 Oct-21 Feb-22 Jun-22 Sep-22 Jan-23 May-23 Aug-23 Dec-23 Background
Checking Sector Has Underperformed the Market Hydro Share Price Over Time (Nasdaq, First Advantage and Sterling Check Rebased
to Hydro) (30%)(1) October 29, 2021 Hydro IPO’d at $19/sh November 14, 2022 Board of Directors announced twoyear $100mm
share buyback program: +23% March 9, 2023 Hydro announced Q4’22 earnings beating full-year and quarterly cons. estimates
for revenue and Adj. EBITDA: +8% (4%) Source: Company filings and FactSet as of December 18, 2023. Note: Percentages in annotations
reflect one-day impact to unaffected unless otherwise specified. (1) Reflects Hydro’s performance since IPO to current.
(2) Reflects Hydro’s share price and performance from IPO to the unaffected date before Gulf and Shore’s 13D filings.
May 12, 2022 Q1’22 earnings missed cons. Adj. EBITDA estimates; stock traded down (10%) over the next 5 days $19.00 November
17, 2023 Gulf and Shore posted Schedule 13D filings after market close: +32% March 21, 2022 Hydro announced Q4’21 earnings
highlighting international revenue diversification: +24% November 3, 2022 Hydro missed Q3’22 revenue versus consensus estimates:
(37%) A Macro / Sector Backdrop (38%) (13%) Hydro Nasdaq (47%)(2) $10.05(2) (11/17/23)
– Highly Confidential;
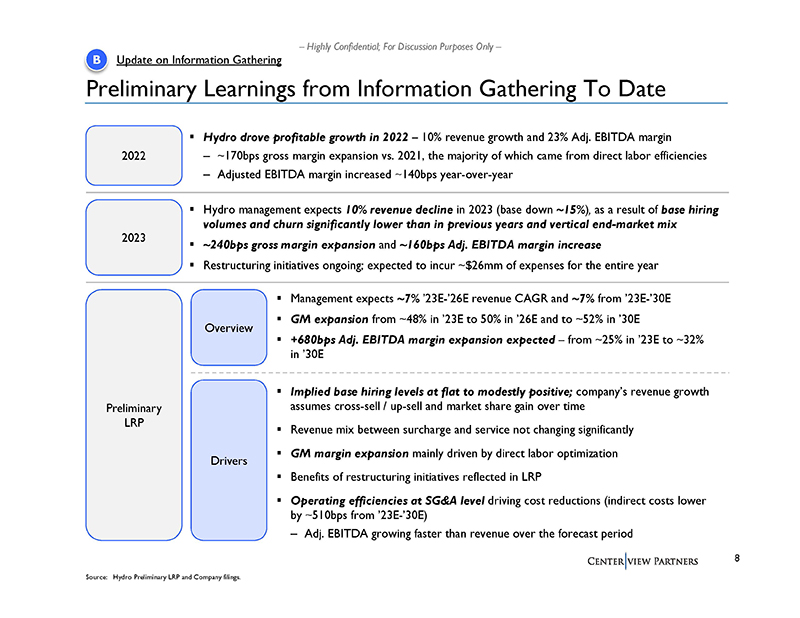
For Discussion Purposes Only – Preliminary Learnings from Information Gathering To Date ▪ Hydro drove profitable growth
in 2022 – 10% revenue growth and 23% Adj. EBITDA margin – ~170bps gross margin expansion vs. 2021, the majority of
which came from direct labor efficiencies – Adjusted EBITDA margin increased ~140bps year-over-year 2023 Preliminary LRP
▪ Management expects ~7% ’23E-’26E revenue CAGR and ~7% from ’23E-’30E ▪ GM expansion from
~48% in ’23E to 50% in ’26E and to ~52% in ’30E ▪ +680bps Adj. EBITDA margin expansion expected –
from ~25% in ’23E to ~32% in ’30E ▪ Hydro management expects 10% revenue decline in 2023 (base down ~15%), as
a result of base hiring volumes and churn significantly lower than in previous years and vertical end-market mix ▪ ~240bps
gross margin expansion and ~160bps Adj. EBITDA margin increase ▪ Restructuring initiatives ongoing; expected to incur ~$26mm
of expenses for the entire year B Update on Information Gathering Overview Drivers ▪ Implied base hiring levels at flat
to modestly positive; company’s revenue growth assumes cross-sell / up-sell and market share gain over time ▪ Revenue
mix between surcharge and service not changing significantly ▪ GM margin expansion mainly driven by direct labor optimization
▪ Benefits of restructuring initiatives reflected in LRP ▪ Operating efficiencies at SG&A level driving cost reductions
(indirect costs lower by ~510bps from ’23E-’30E) – Adj. EBITDA growing faster than revenue over the forecast
period Source: Hydro Preliminary LRP and Company filings. 2022
– Highly Confidential;
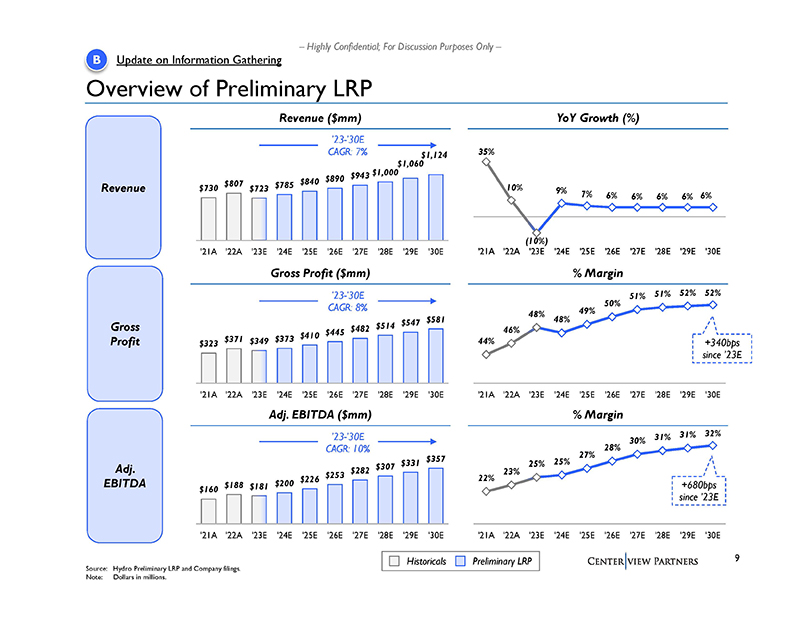
For Discussion Purposes Only – $160 $188 $181 $200 $226 $253 $282 $307 $331 $357 '21A '22A '23E '24E '25E '26E '27E '28E
'29E '30E Source: Hydro Preliminary LRP and Company filings. Note: Dollars in millions. Overview of Preliminary LRP Adj. EBITDA
($mm) % Margin Revenue Gross Profit Adj. EBITDA Historicals Preliminary LRP 35% 10% (10%) 9% 7% 6% 6% 6% 6% 6% '21A '22A '23E
'24E '25E '26E '27E '28E '29E '30E $730 $807 $723 $785 $840 $890 $943 $1,000 $1,060 $1,124 '21A '22A '23E '24E '25E '26E '27E
'28E '29E '30E Revenue ($mm) YoY Growth (%) ’23-’30E CAGR: 7% ’23-’30E CAGR: 10% B Update on Information
Gathering 22% 23% 25% 25% 27% 28% 30% 31% 31% 32% '21A '22A '23E '24E '25E '26E '27E '28E '29E '30E $323 $371 $349 $373 $410 $445
$482 $514 $547 $581 '21A '22A '23E '24E '25E '26E '27E '28E '29E '30E Gross Profit ($mm) % Margin ’23-’30E CAGR: 8%
44% 46% 48% 48% 49% 50% 51% 51% 52% 52% '21A '22A '23E '24E '25E '26E '27E '28E '29E '30E +340bps since ’23E +680bps since
’23E
– Highly Confidential;
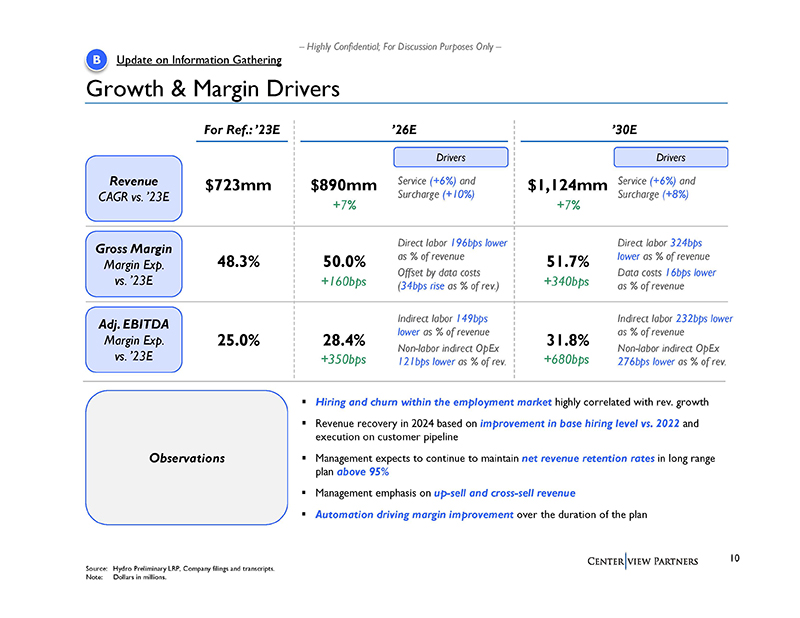
For Discussion Purposes Only – Growth & Margin Drivers Revenue CAGR vs. ’23E For Ref.: ’23E ’26E ’30E
$723mm $890mm $1,124mm +7% +7% Gross Margin Margin Exp. vs. ’23E 48.3% 50.0% 51.7% +160bps +340bps Adj. EBITDA Margin Exp.
vs. ’23E 25.0% 28.4% 31.8% +350bps +680bps Source: Hydro Preliminary LRP, Company filings and transcripts. Note: Dollars
in millions. Observations Service (+6%) and Surcharge (+10%) Drivers Drivers Service (+6%) and Surcharge (+8%) B Update on Information
Gathering ▪ Hiring and churn within the employment market highly correlated with rev. growth ▪ Revenue recovery in
2024 based on improvement in base hiring level vs. 2022 and execution on customer pipeline ▪ Management expects to continue
to maintain net revenue retention rates in long range plan above 95% ▪ Management emphasis on up-sell and cross-sell revenue
▪ Automation driving margin improvement over the duration of the plan Direct labor 324bps lower as % of revenue Data costs
16bps lower as % of revenue Direct labor 196bps lower as % of revenue Offset by data costs (34bps rise as % of rev.) Indirect
labor 149bps lower as % of revenue Non-labor indirect OpEx 121bps lower as % of rev. Indirect labor 232bps lower as % of revenue
Non-labor indirect OpEx 276bps lower as % of rev.
– Highly Confidential;
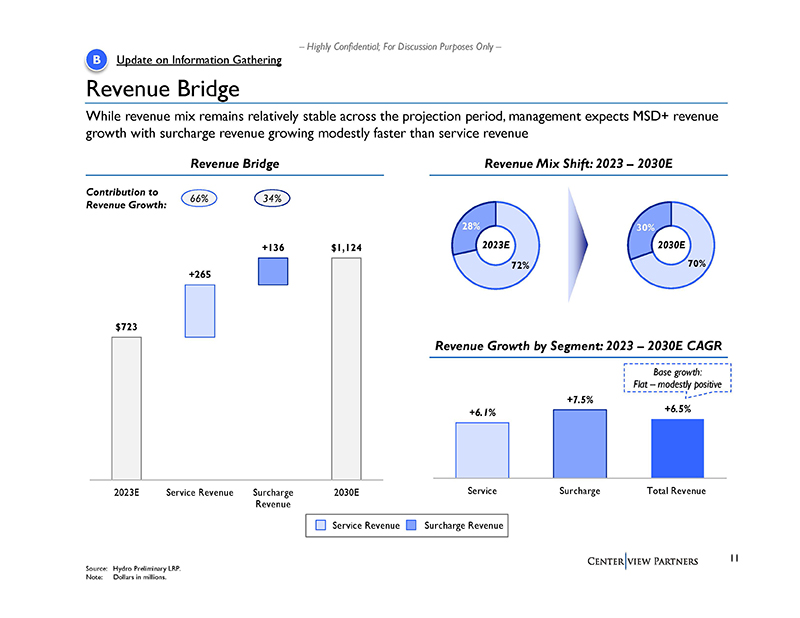
For Discussion Purposes Only – $723 +265 +136 $1,124 2023E Service Revenue Surcharge Revenue 2030E 72% 28% 70% 30% Revenue
Bridge Source: Hydro Preliminary LRP. Note: Dollars in millions. B Update on Information Gathering Contribution to 66% 34% Revenue
Growth: Revenue Bridge Revenue Mix Shift: 2023 – 2030E Service Revenue Surcharge Revenue 2023E 2030E Revenue Growth by Segment:
2023 – 2030E CAGR +6.1% +7.5% +6.5% Service Surcharge Total Revenue While revenue mix remains relatively stable across the
projection period, management expects MSD+ revenue growth with surcharge revenue growing modestly faster than service revenue
Base growth: Flat – modestly positive
– Highly Confidential;
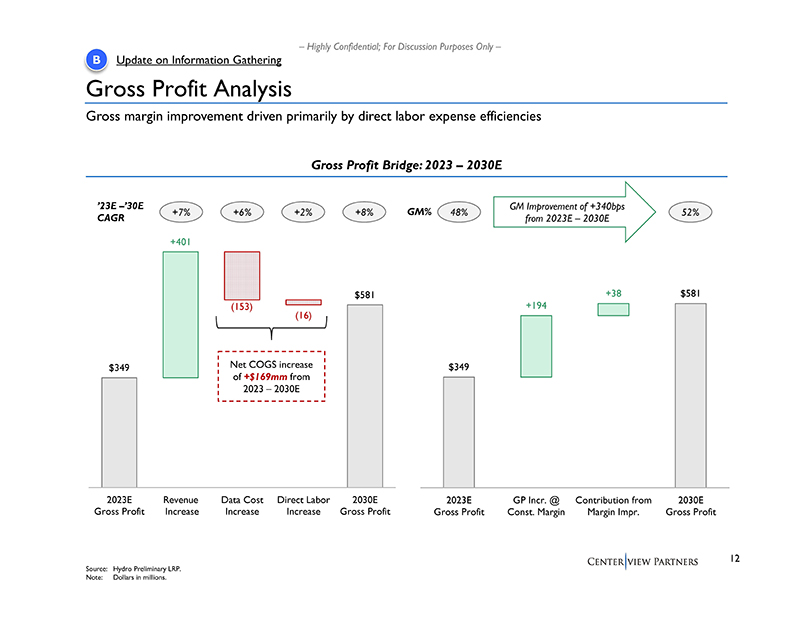
For Discussion Purposes Only – $349 +401 (153) (16) $581 2023E Gross Profit Revenue Increase Data Cost Increase Direct Labor
Increase 2030E Gross Profit Gross Profit Analysis Source: Hydro Preliminary LRP. Note: Dollars in millions. B Update on Information
Gathering Gross Profit Bridge: 2023 – 2030E +7% +6% ’23E –’30E CAGR +2% +8% Net COGS increase of +$169mm
from 2023 – 2030E Gross margin improvement driven primarily by direct labor expense efficiencies $349 +194 +38 $581 2023E
Gross Profit GP Incr. @ Const. Margin Contribution from Margin Impr. 2030E Gross Profit 48% GM Improvement of +340bps 52% from
2023E – 2030E GM%
– Highly Confidential;
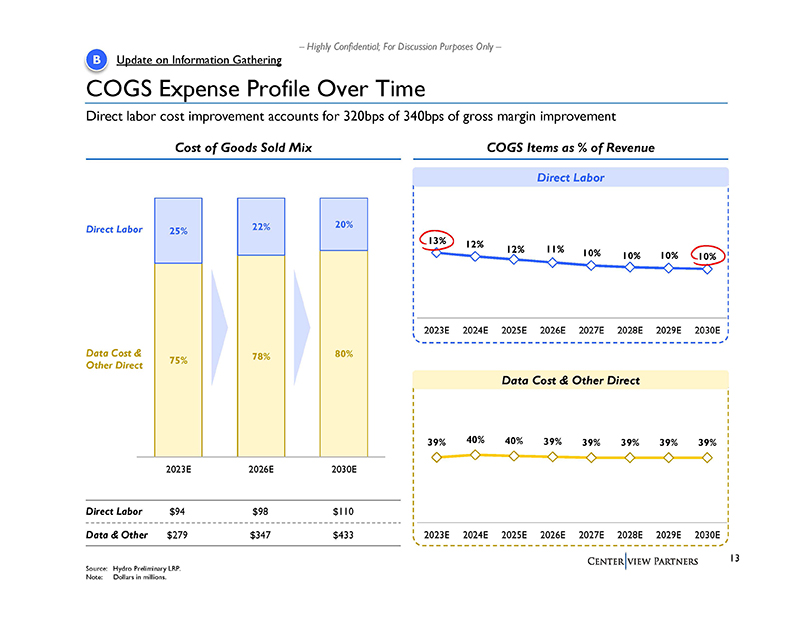
For Discussion Purposes Only – COGS Expense Profile Over Time B Update on Information Gathering Source: Hydro Preliminary
LRP. Note: Dollars in millions. Cost of Goods Sold Mix COGS Items as % of Revenue Direct Labor 13% 12% 12% 11% 10% 10% 10% 10%
2023E 2024E 2025E 2026E 2027E 2028E 2029E 2030E 75% 78% 80% 25% 22% 20% 2023E 2026E 2030E Direct Labor Data Cost & Other Direct
Data Cost & Other Direct 39% 40% 40% 39% 39% 39% 39% 39% 2023E 2024E 2025E 2026E 2027E 2028E 2029E 2030E Direct Labor $94
$98 $110 Data & Other $279 $347 $433 Direct labor cost improvement accounts for 320bps of 340bps of gross margin improvement
– Highly Confidential;
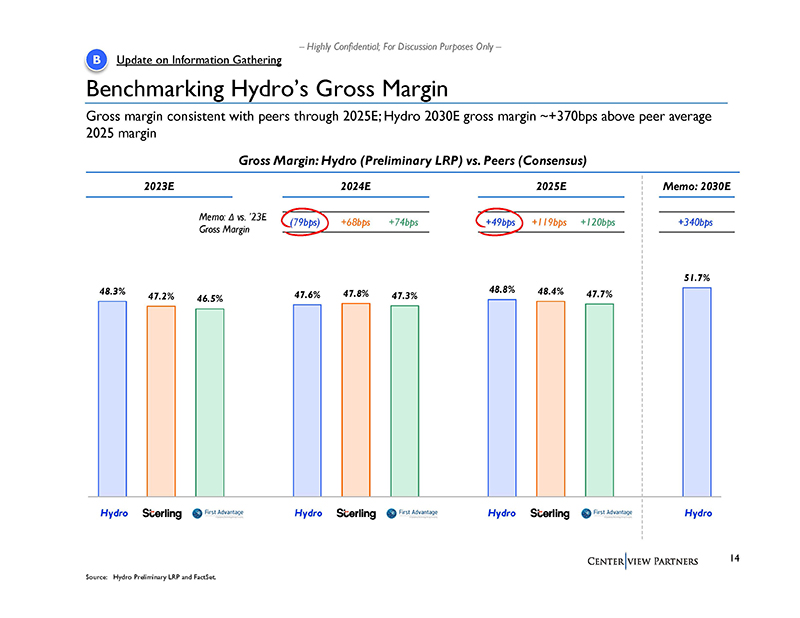
For Discussion Purposes Only – 48.3% 47.2% 46.5% 47.6% 47.8% 47.3% 48.8% 48.4% 47.7% 51.7% Benchmarking Hydro’s Gross
Margin B Update on Information Gathering Gross Margin: Hydro (Preliminary LRP) vs. Peers (Consensus) Hydro Hydro Hydro Hydro Memo:
Δ vs. ’23E Gross Margin Source: Hydro Preliminary LRP and FactSet. Gross margin consistent with peers through 2025E;
Hydro 2030E gross margin ~+370bps above peer average 2025 margin 2023E 2024E 2025E Memo: 2030E (79bps) +68bps +74bps +49bps +119bps
+120bps +340bps
– Highly Confidential;
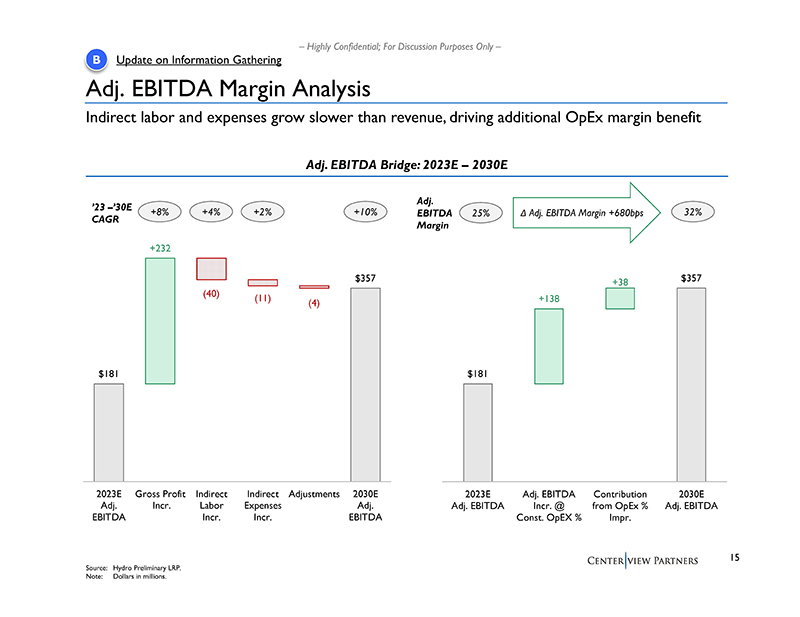
For Discussion Purposes Only – $181 +138 +38 $357 2023E Adj. EBITDA Adj. EBITDA Incr. @ Const. OpEX % Contribution from
OpEx % Impr. 2030E Adj. EBITDA $181 +232 (40) (11) (4) $357 2023E Adj. EBITDA Gross Profit Incr. Indirect Labor Incr. Indirect
Expenses Incr. Adjustments 2030E Adj. EBITDA Adj. EBITDA Margin Analysis B Update on Information Gathering ’23 –’30E
+8% +4% CAGR +2% Indirect labor and expenses grow slower than revenue, driving additional OpEx margin benefit Source: Hydro Preliminary
LRP. Note: Dollars in millions. +10% Adj. EBITDA Bridge: 2023E – 2030E 25% Δ Adj. EBITDA Margin +680bps 32% Adj. EBITDA
Margin
– Highly Confidential;
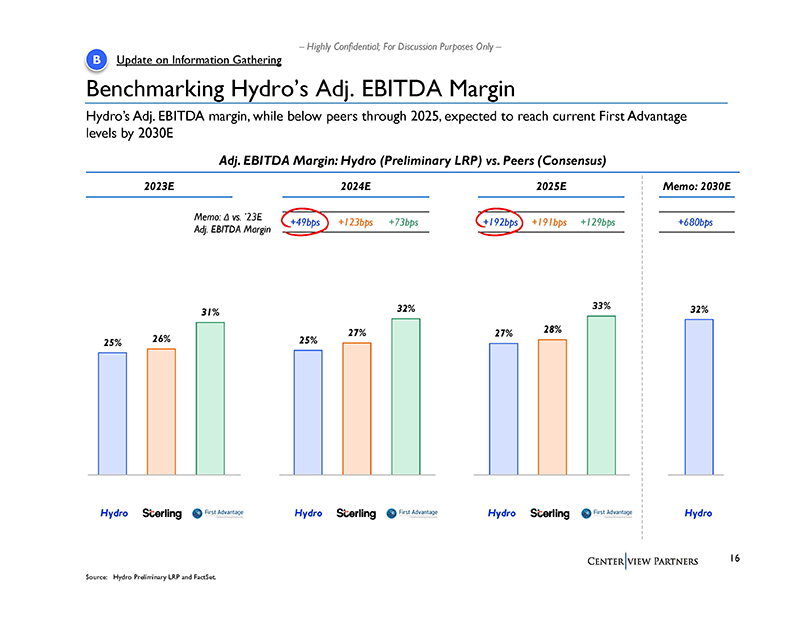
For Discussion Purposes Only – 25% 26% 31% 25% 27% 32% 27% 28% 33% 32% Benchmarking Hydro’s Adj. EBITDA Margin B Update
on Information Gathering Adj. EBITDA Margin: Hydro (Preliminary LRP) vs. Peers (Consensus) Hydro Hydro Hydro Hydro Hydro’s
Adj. EBITDA margin, while below peers through 2025, expected to reach current First Advantage levels by 2030E 2023E 2024E 2025E
Memo: 2030E Memo: Δ vs. ’23E +49bps +123bps +73bps +192bps +191bps +129bps +680bps Adj. EBITDA Margin Source: Hydro
Preliminary LRP and FactSet.
– Highly Confidential;
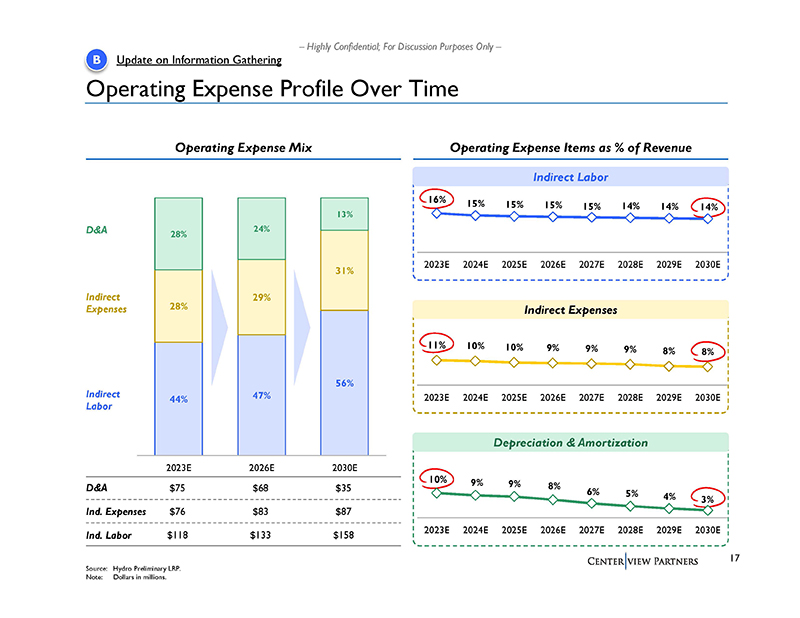
For Discussion Purposes Only – Operating Expense Profile Over Time B Update on Information Gathering Source: Hydro Preliminary
LRP. Note: Dollars in millions. Operating Expense Mix Operating Expense Items as % of Revenue Indirect Labor Indirect Labor Indirect
Expenses Indirect Expenses 11% 10% 10% 9% 9% 9% 8% 8% 2023E 2024E 2025E 2026E 2027E 2028E 2029E 2030E Ind. Labor $75 $68 $35 Ind.
Expenses $76 $83 $87 D&A $118 $133 $158 44% 47% 56% 28% 29% 31% 28% 24% 13% 2023E 2026E 2030E D&A Depreciation & Amortization
10% 9% 9% 8% 6% 5% 4% 3% 2023E 2024E 2025E 2026E 2027E 2028E 2029E 2030E 16% 15% 15% 15% 15% 14% 14% 14% 2023E 2024E 2025E 2026E
2027E 2028E 2029E 2030E
– Highly Confidential;
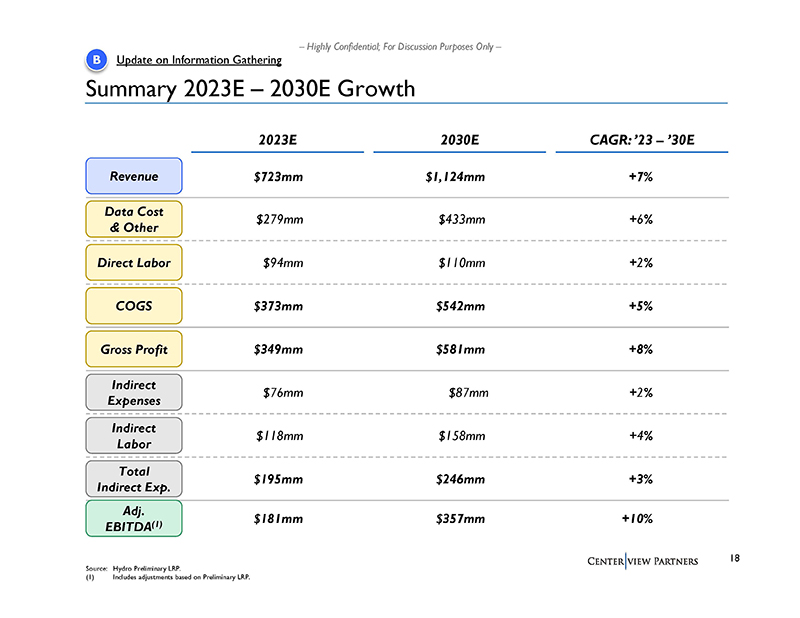
For Discussion Purposes Only – Summary 2023E – 2030E Growth B Update on Information Gathering Source: Hydro Preliminary
LRP. (1) Includes adjustments based on Preliminary LRP. 2023E 2030E CAGR: ’23 – ’30E Revenue Data Cost &
Other Direct Labor Indirect Expenses Indirect Labor COGS $723mm $1,124mm +7% $279mm $433mm +6% $94mm $110mm +2% $373mm $542mm
+5% $76mm $87mm +2% $118mm $158mm +4% Adj. EBITDA(1) $181mm $357mm +10% Gross Profit Total Indirect Exp. $349mm $581mm +8% $195mm
$246mm +3%
– Highly Confidential;
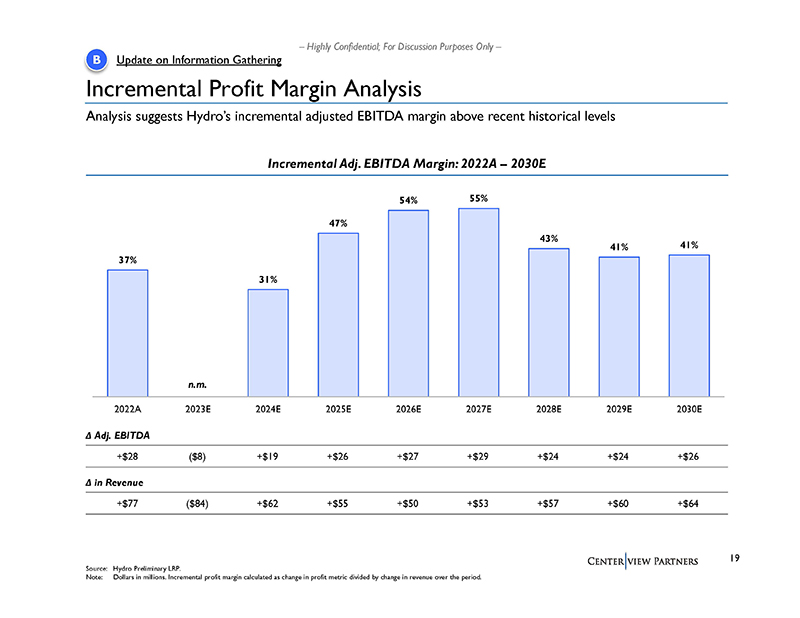
For Discussion Purposes Only – Incremental Profit Margin Analysis B Update on Information Gathering Source: Hydro Preliminary
LRP. Note: Dollars in millions. Incremental profit margin calculated as change in profit metric divided by change in revenue over
the period. Incremental Adj. EBITDA Margin: 2022A – 2030E Δ in Revenue Δ Adj. EBITDA +$28 ($8) +$19 +$26 +$27
+$29 +$24 Analysis suggests Hydro’s incremental adjusted EBITDA margin above recent historical levels +$77 ($84) +$62 +$55
+$50 +$53 +$57 37% 31% 47% 54% 55% 43% 41% 41% 2022A 2023E 2024E 2025E 2026E 2027E 2028E 2029E 2030E +$24 +$26 +$60 +$64 n.m.
– Highly Confidential;
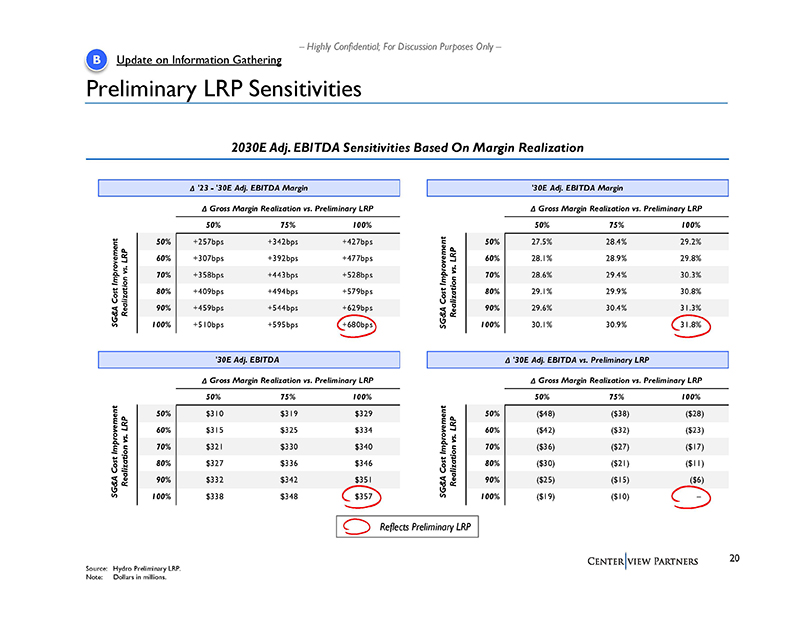
For Discussion Purposes Only – Δ '30E Adj. EBITDA vs. Preliminary LRP Δ Gross Margin Realization vs. Preliminary
LRP 50% 75% 100% 50% ($48) ($38) ($28) 60% ($42) ($32) ($23) 70% ($36) ($27) ($17) 80% ($30) ($21) ($11) 90% ($25) ($15) ($6)
100% ($19) ($10) – '30E Adj. EBITDA Margin Δ Gross Margin Realization vs. Preliminary LRP 50% 75% 100% 50% 27.5% 28.4%
29.2% 60% 28.1% 28.9% 29.8% 70% 28.6% 29.4% 30.3% 80% 29.1% 29.9% 30.8% 90% 29.6% 30.4% 31.3% 100% 30.1% 30.9% 31.8% '30E Adj.
EBITDA Δ Gross Margin Realization vs. Preliminary LRP 50% 75% 100% 50% $310 $319 $329 60% $315 $325 $334 70% $321 $330 $340
80% $327 $336 $346 90% $332 $342 $351 100% $338 $348 $357 Δ '23 - '30E Adj. EBITDA Margin Δ Gross Margin Realization
vs. Preliminary LRP 50% 75% 100% 50% +257bps +342bps +427bps 60% +307bps +392bps +477bps 70% +358bps +443bps +528bps 80% +409bps
+494bps +579bps 90% +459bps +544bps +629bps 100% +510bps +595bps +680bps Preliminary LRP Sensitivities Source: Hydro Preliminary
LRP. Note: Dollars in millions. B Update on Information Gathering 2030E Adj. EBITDA Sensitivities Based On Margin Realization
Reflects Preliminary LRP SG&A Cost Improvement Realization vs. LRP SG&A Cost Improvement Realization vs. LRP SG&A
Cost Improvement Realization vs. LRP SG&A Cost Improvement Realization vs. LRP
– Highly Confidential;
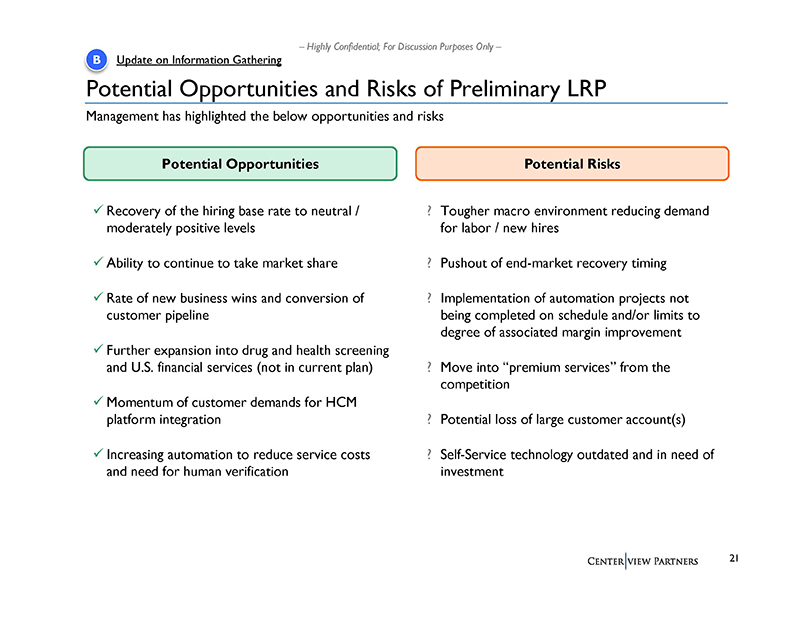
For Discussion Purposes Only – Potential Opportunities and Risks of Preliminary LRP Potential Opportunities Potential Risks
? Tougher macro environment reducing demand for labor / new hires ? Pushout of end-market recovery timing ? Implementation of
automation projects not being completed on schedule and/or limits to degree of associated margin improvement ? Move into “premium
services” from the competition ? Potential loss of large customer account(s) ? Self-Service technology outdated and in need
of investment x Recovery of the hiring base rate to neutral / moderately positive levels x Ability to continue to take market
share x Rate of new business wins and conversion of customer pipeline x Further expansion into drug and health screening and U.S.
financial services (not in current plan) x Momentum of customer demands for HCM platform integration x Increasing automation to
reduce service costs and need for human verification Management has highlighted the below opportunities and risks B Update on
Information Gathering
– Highly Confidential;
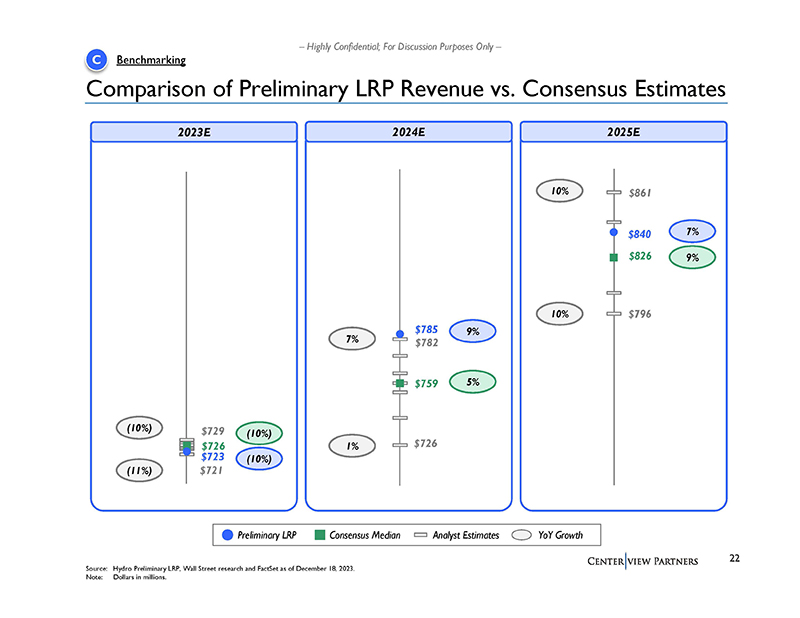
For Discussion Purposes Only – 2023E 2024E Comparison of Preliminary LRP Revenue vs. Consensus Estimates 5% 9% 7% Source:
Hydro Preliminary LRP, Wall Street research and FactSet as of December 18, 2023. Note: Dollars in millions. 1% 2025E 9% 7% 10%
C Benchmarking 10% Preliminary LRP Consensus Median Analyst Estimates YoY Growth $729 $721 $726 $723 (10%) (10%) (10%) (11%) $726
$782 $759 $785 $796 $861 $826 $840
– Highly Confidential;
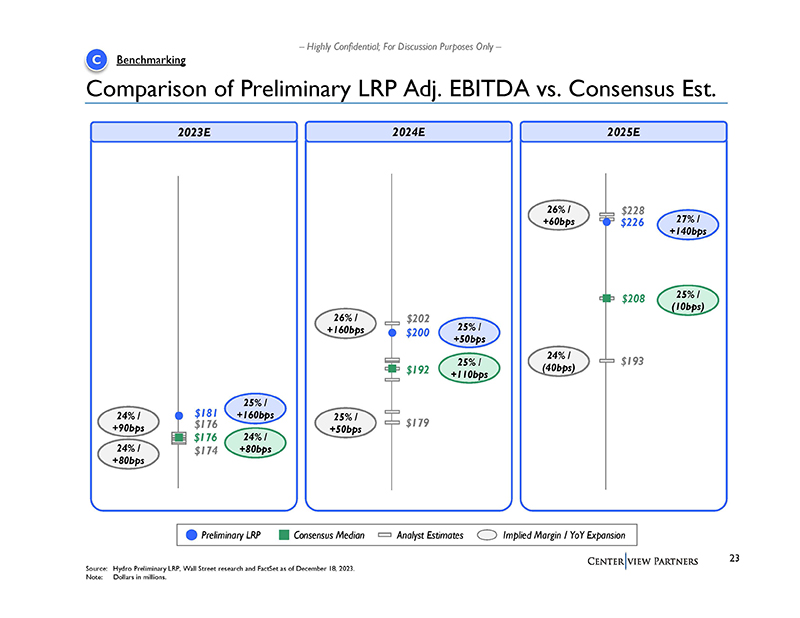
For Discussion Purposes Only – 2023E 2024E Comparison of Preliminary LRP Adj. EBITDA vs. Consensus Est. 2025E C Benchmarking
24% / +90bps 24% / +80bps 25% / +160bps 24% / +80bps 26% / +160bps 25% / +110bps 25% / +50bps 25% / +50bps 25% / (10bps) 27% /
+140bps 24% / (40bps) 26% / +60bps Preliminary LRP Consensus Median Analyst Estimates Implied Margin / YoY Expansion $176 $174
$176 $181 $193 $228 $208 $226 $202 $179 $192 $200 Source: Hydro Preliminary LRP, Wall Street research and FactSet as of December
18, 2023. Note: Dollars in millions.

– Highly Confidential;
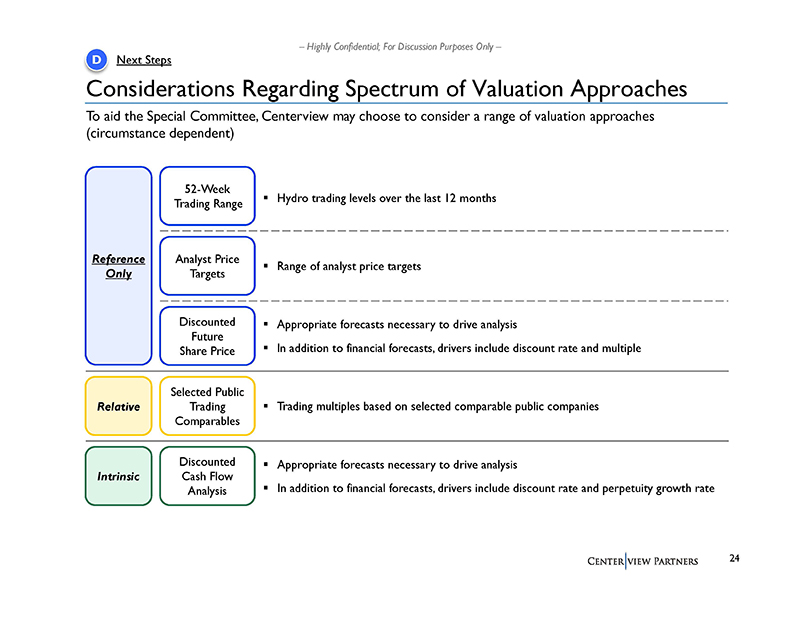
For Discussion Purposes Only – Considerations Regarding Spectrum of Valuation Approaches Intrinsic Relative ▪ Trading
multiples based on selected comparable public companies ▪ Appropriate forecasts necessary to drive analysis ▪ In addition
to financial forecasts, drivers include discount rate and perpetuity growth rate Reference Only ▪ Hydro trading levels over
the last 12 months Discounted Cash Flow Analysis Selected Public Trading Comparables Analyst Price Targets 52-Week Trading Range
▪ Range of analyst price targets Discounted Future Share Price ▪ Appropriate forecasts necessary to drive analysis
▪ In addition to financial forecasts, drivers include discount rate and multiple To aid the Special Committee, Centerview
may choose to consider a range of valuation approaches (circumstance dependent) D Next Steps
Appendix Supplementary Materials
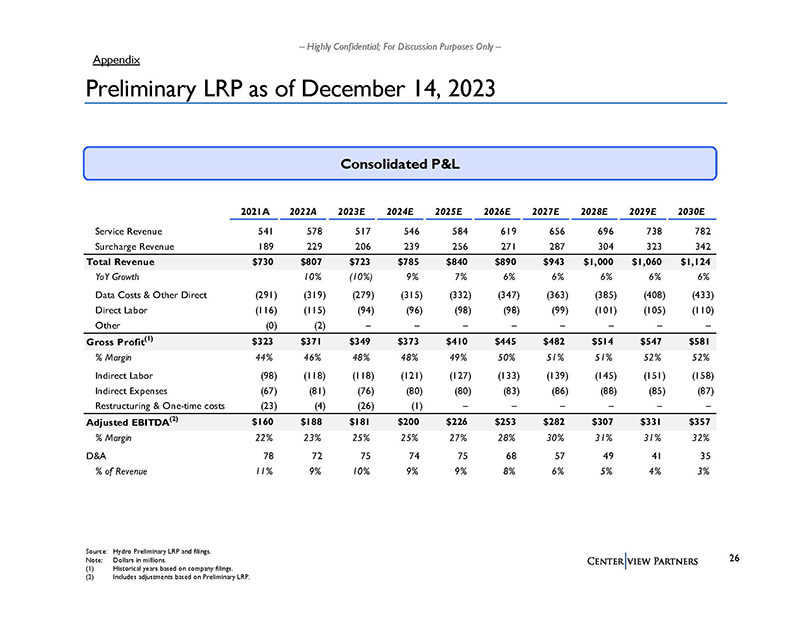
– Highly Confidential; For Discussion Purposes Only – Preliminary LRP as of December 14, 2023 Consolidated P&L Appendix Source: Hydro Preliminary LRP and filings. Note: Dollars in millions. (1) Historical years based on company filings. (2) Includes adjustments based on Preliminary LRP. 2021A 2022A 2023E 2024E 2025E 2026E 2027E 2028E 2029E 2030E Service Revenue 541 578 517 546 584 619 656 696 738 782 Surcharge Revenue 189 229 206 239 256 271 287 304 323 342 Total Revenue $730 $807 $723 $785 $840 $890 $943 $1,000 $1,060 $1,124 YoY Growth 10% (10%) 9% 7% 6% 6% 6% 6% 6% Data Costs & Other Direct (291) (319) (279) (315) (332) (347) (363) (385) (408) (433) Direct Labor (116) (115) (94) (96) (98) (98) (99) (101) (105) (110) Other (0) (2) – – – – – – – – Gross Profit(1) $323 $371 $349 $373 $410 $445 $482 $514 $547 $581 % Margin 44% 46% 48% 48% 49% 50% 51% 51% 52% 52% Indirect Labor (98) (118) (118) (121) (127) (133) (139) (145) (151) (158) Indirect Expenses (67) (81) (76) (80) (80) (83) (86) (88) (85) (87) Restructuring & One-time costs (23) (4) (26) (1) – – – – – – Adjusted EBITDA(2) $160 $188 $181 $200 $226 $253 $282 $307 $331 $357 % Margin 22% 23% 25% 25% 27% 28% 30% 31% 31% 32% D&A 78 72 75 74 75 68 57 49 41 35 % of Revenue 11% 9% 10% 9% 9% 8% 6% 5% 4% 3%