
Exhibit c(iv)

– Highly Confidential; For Discussion Purposes Only – January 26, 2024 Discussion Materials for the Special Committee Project Hydro
– Highly Confidential; For Discussion Purposes Only – Disclaimer This presentation has been prepared by Centerview Partners LLC (“Centerview”) for use solely by the Special Committee of the Board of Directors of HireRight Holdings Corporation (“Hydro”, the “Company” or the “Special Committee”) in connection with its evaluation of proposed strategic alternatives for Hydro and for no other purpose. The information contained herein is based upon information supplied by or on behalf of Hydro and publicly available information, and portions of the information contained herein may be based upon statements, estimates and forecasts provided by Hydro. Centerview has relied upon the accuracy and completeness of the foregoing information, and has not assumed any responsibility for any independent verification of such information or for any independent evaluation or appraisal of any of the assets or liabilities (contingent or otherwise) of Hydro or any other entity, or concerning the solvency or fair value of Hydro or any other entity. Any financial analysis in this presentation is complex and is not necessarily susceptible to a partial analysis or summary description. In performing any financial analysis, Centerview has considered the results of its analysis as a whole and did not necessarily attribute a particular weight to any particular portion of the analysis considered. Furthermore, selecting any portion of Centerview’s analysis, without considering the analysis as a whole, would create an incomplete view of the process underlying its financial analysis. Centerview may have deemed various assumptions more or less probable than other assumptions, so the reference ranges resulting from any particular portion of the analysis described above should not be taken to be Centerview’s view of the actual value of Hydro. These materials and the information contained herein are confidential, were not prepared with a view toward public disclosure, and may not be disclosed publicly or made available to third parties without the prior written consent of Centerview. These materials and any other advice, written or oral, rendered by Centerview are intended solely for the benefit and use of the Special Committee of the Board of Directors of Hydro (in its capacity as such) in its consideration of strategic alternatives, and are not for the benefit of, and do not convey any rights or remedies for any holder of securities of Hydro or any other person. Centerview will not be responsible for and has not provided any tax, accounting, actuarial, legal or other specialist advice. These materials are not intended to provide the sole basis for evaluating strategic alternatives, and this presentation does not represent a fairness opinion, recommendation, valuation or opinion of any kind, and is necessarily incomplete and should be viewed solely in conjunction with the oral presentation provided by Centerview.
– Highly Confidential; For Discussion Purposes Only – Discussion Agenda Long Range Plan in Context Illustrative Valuation Analysis Selected Precedents and Next Steps
Long Range Plan in Context Section 1
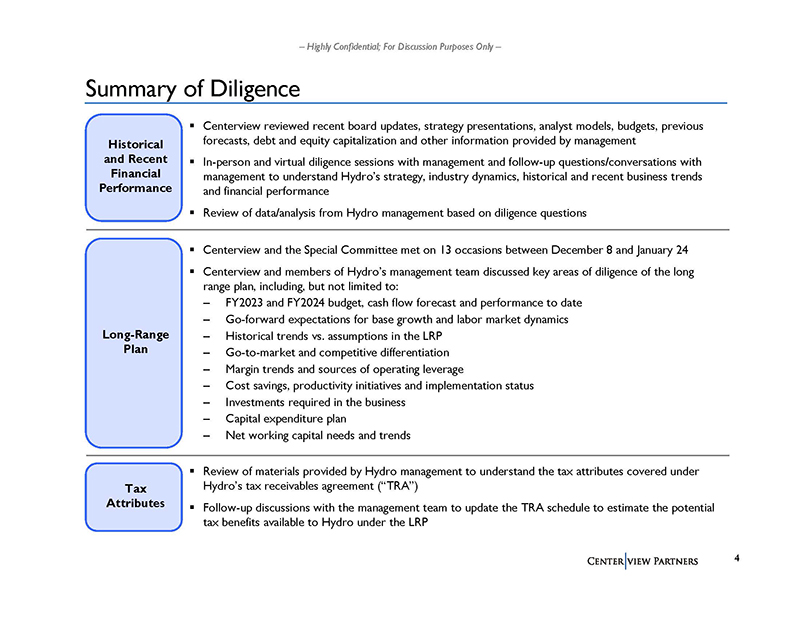
Highly Confidential; For Discussion Purposes Only – Summary of Diligence Historical and Recent Financial Performance Tax Attributes ▪ Centerview reviewed recent board updates, strategy presentations, analyst models, budgets, previous forecasts, debt and equity capitalization and other information provided by management ▪ In-person and virtual diligence sessions with management and follow-up questions/conversations with management to understand Hydro’s strategy, industry dynamics, historical and recent business trends and financial performance ▪ Review of data/analysis from Hydro management based on diligence questions Long-Range Plan ▪ Centerview and the Special Committee met on 13 occasions between December 8 and January 24 ▪ Centerview and members of Hydro’s management team discussed key areas of diligence of the long range plan, including, but not limited to: – FY2023 and FY2024 budget, cash flow forecast and performance to date – Go-forward expectations for base growth and labor market dynamics – Historical trends vs. assumptions in the LRP – Go-to-market and competitive differentiation – Margin trends and sources of operating leverage – Cost savings, productivity initiatives and implementation status – Investments required in the business – Capital expenditure plan – Net working capital needs and trends ▪ Review of materials provided by Hydro management to understand the tax attributes covered under Hydro’s tax receivables agreement (“TRA”) ▪ Follow-up discussions with the management team to update the TRA schedule to estimate the potential tax benefits available to Hydro under the LRP
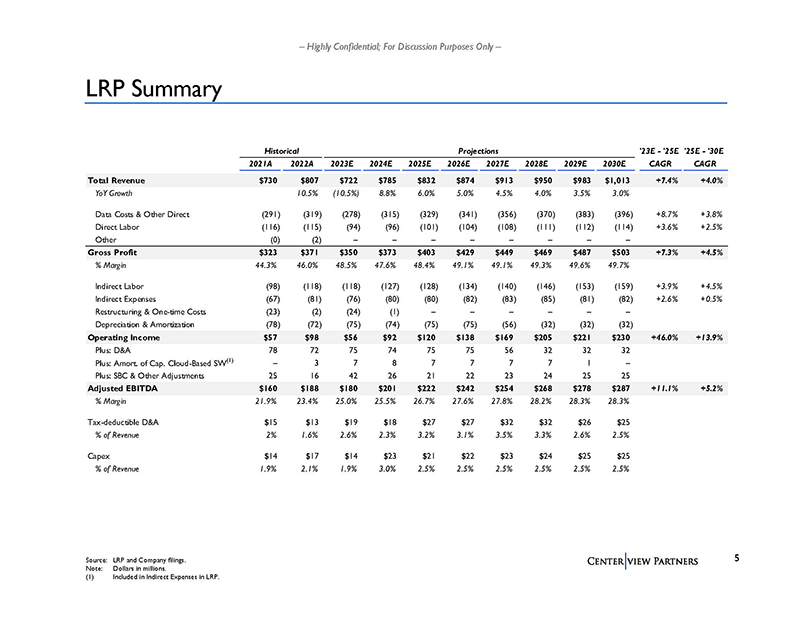
Highly Confidential; For Discussion Purposes Only – LRP Summary Source: LRP and Company filings. Note: Dollars in millions. (1) Included in Indirect Expenses in LRP. Historical Projections '23E - '25E '25E - '30E 2021A 2022A 2023E 2024E 2025E 2026E 2027E 2028E 2029E 2030E CAGR CAGR Total Revenue $730 $807 $722 $785 $832 $874 $913 $950 $983 $1,013 +7.4% +4.0% YoY Growth 10.5% (10.5%) 8.8% 6.0% 5.0% 4.5% 4.0% 3.5% 3.0% Data Costs & Other Direct (291) (319) (278) (315) (329) (341) (356) (370) (383) (396) +8.7% +3.8% Direct Labor (116) (115) (94) (96) (101) (104) (108) (111) (112) (114) +3.6% +2.5% Other (0) (2) – – – – – – – – Gross Profit $323 $371 $350 $373 $403 $429 $449 $469 $487 $503 +7.3% +4.5% % Margin 44.3% 46.0% 48.5% 47.6% 48.4% 49.1% 49.1% 49.3% 49.6% 49.7% Indirect Labor (98) (118) (118) (127) (128) (134) (140) (146) (153) (159) +3.9% +4.5% Indirect Expenses (67) (81) (76) (80) (80) (82) (83) (85) (81) (82) +2.6% +0.5% Restructuring & O ne-time Costs (23) (2) (24) (1) – – – – – – Depreciation & Amortization (78) (72) (75) (74) (75) (75) (56) (32) (32) (32) Operating Income $57 $98 $56 $92 $120 $138 $169 $205 $221 $230 +46.0% +13.9% Plus: D&A 78 72 75 74 75 75 56 32 32 32 Plus: Amort. of Cap. Cloud-Based SW(1) – 3 7 8 7 7 7 7 1 – Plus: SBC & Other Adjustments 25 16 42 26 21 22 23 24 25 25 Adjusted EBITDA $160 $188 $180 $201 $222 $242 $254 $268 $278 $287 +11.1% +5.2% % Margin 21.9% 23.4% 25.0% 25.5% 26.7% 27.6% 27.8% 28.2% 28.3% 28.3% Tax-deductible D&A $15 $13 $19 $18 $27 $27 $32 $32 $26 $25 % of Revenue 2% 1.6% 2.6% 2.3% 3.2% 3.1% 3.5% 3.3% 2.6% 2.5% Capex $14 $17 $14 $23 $21 $22 $23 $24 $25 $25 % of Revenue 1.9% 2.1% 1.9% 3.0% 2.5% 2.5% 2.5% 2.5% 2.5% 2.5%
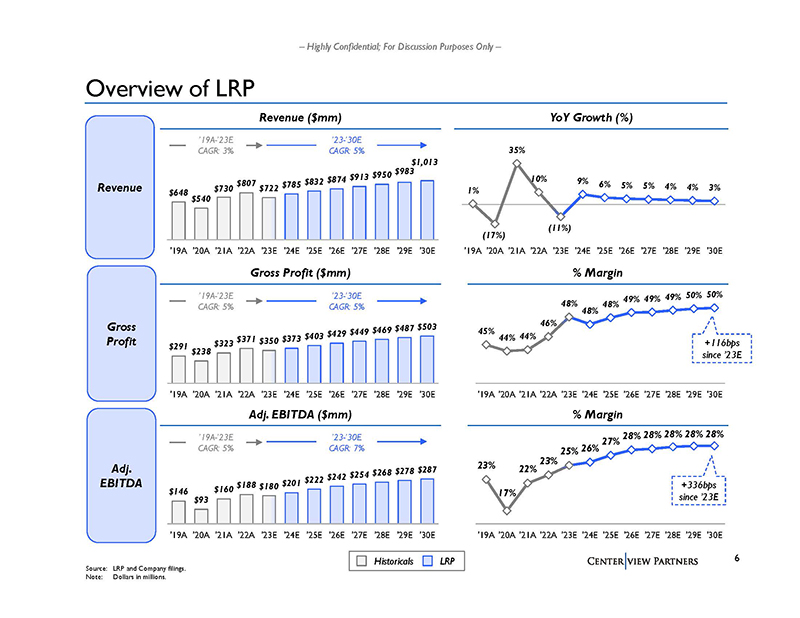
– Highly Confidential; For Discussion Purposes Only – $146 $93 $160 $188 $180 $201 $222 $242 $254 $268 $278 $287 '19A '20A '21A '22A '23E '24E '25E '26E '27E '28E '29E '30E Source: LRP and Company filings. Note: Dollars in millions. Overview of LRP Adj. EBITDA ($mm) % Margin Revenue Gross Profit Adj. EBITDA Historicals LRP 1% (17%) 35% 10% (11%) 9% 6% 5% 5% 4% 4% 3% '19A '20A '21A '22A '23E '24E '25E '26E '27E '28E '29E '30E $648 $540 $730 $807 $722 $785 $832 $874 $913 $950 $983 $1,013 '19A '20A '21A '22A '23E '24E '25E '26E '27E '28E '29E '30E Revenue ($mm) YoY Growth (%) ’23-’30E CAGR: 5% ’23-’30E CAGR: 7% 23% 17% 22% 23% 25% 26% 27% 28% 28% 28% 28% 28% '19A '20A '21A '22A '23E '24E '25E '26E '27E '28E '29E '30E $291 $238 $323 $371 $350 $373 $403 $429 $449 $469 $487 $503 '19A '20A '21A '22A '23E '24E '25E '26E '27E '28E '29E '30E Gross Profit ($mm) % Margin ’23-’30E CAGR: 5% 45% 44% 44% 46% 48% 48% 48% 49% 49% 49% 50% 50% '19A '20A '21A '22A '23E '24E '25E '26E '27E '28E '29E '30E +116bps since ’23E +336bps since ’23E ’19A-’23E CAGR: 3% ’19A-’23E CAGR: 5% ’19A-’23E CAGR: 5%
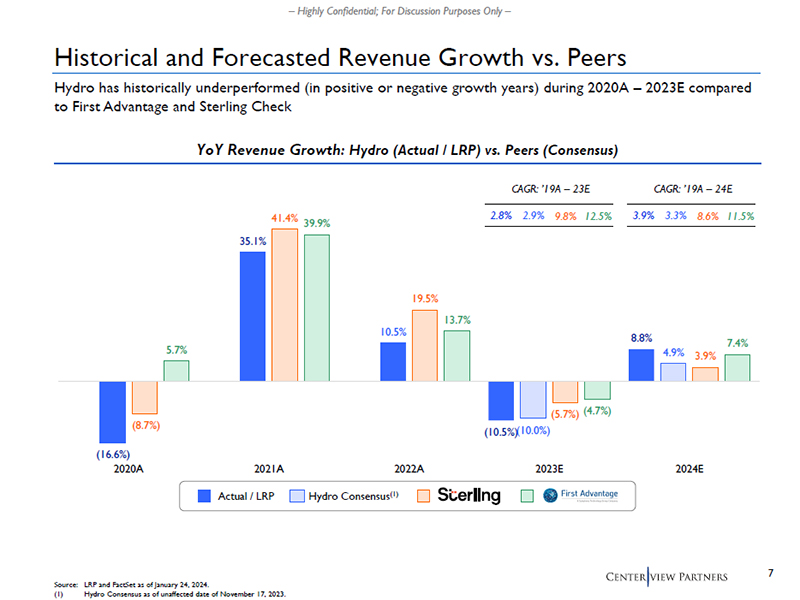
– Highly Confidential; For Discussion Purposes Only – (16.6%) 35.1% 10.5% (10.5%) 8.8% (16.6%) 35.1% 10.5% (10.0%) 4.9% (8.7%) 41.4% 19.5% (5.7%) 5.7% 3.9% 39.9% 13.7% (4.7%) 7.4% 2020A 2021A 2022A 2023E 2024E Historical and Forecasted Revenue Growth vs. Peers Actual / LRP Hydro Consensus(1) Source: LRP and FactSet as of January 24, 2024. (1) Hydro Consensus as of unaffected date of November 17, 2023. YoY Revenue Growth: Hydro (Actual / LRP) vs. Peers (Consensus) CAGR: ’19A – 23E 2.8% 2.9% 9.8% 12.5% CAGR: ’19A – 24E 3.9% 3.3% 8.6% 11.5% Hydro has historically underperformed (in positive or negative growth years) during 2020A – 2023E compared to First Advantage and Sterling Check
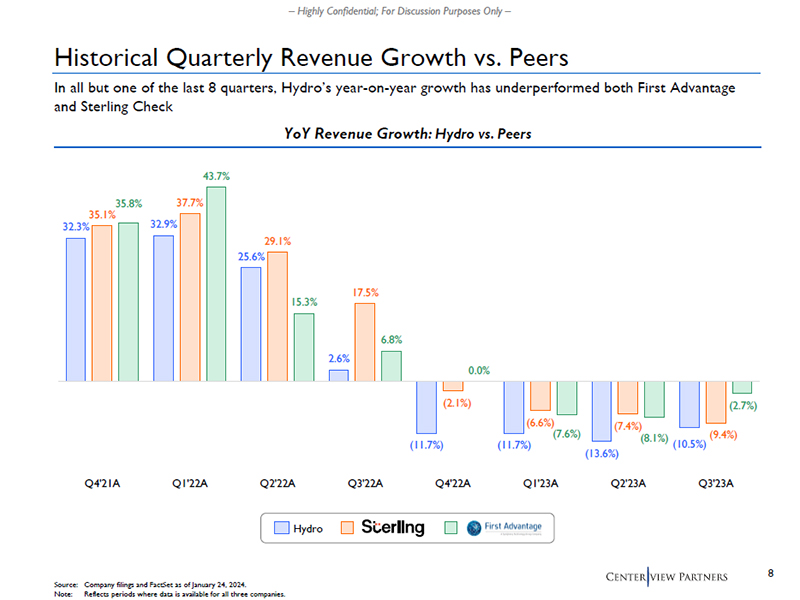
– Highly Confidential; For Discussion Purposes Only – 32.3% 32.9% 25.6% 2.6% (11.7%) (11.7%) (13.6%) (10.5%) 35.1% 37.7% 29.1% 17.5% (2.1%) (6.6%) (7.4%) (9.4%) 35.8% 43.7% 15.3% 6.8% 0.0% (7.6%) (8.1%) (2.7%) Q4'21A Q1'22A Q2'22A Q3'22A Q4'22A Q1'23A Q2'23A Q3'23A Historical Quarterly Revenue Growth vs. Peers Hydro Source: Company filings and FactSet as of January 24, 2024. Note: Reflects periods where data is available for all three companies. YoY Revenue Growth: Hydro vs. Peers In all but one of the last 8 quarters, Hydro’s year-on-year growth has underperformed both First Advantage and Sterling Check
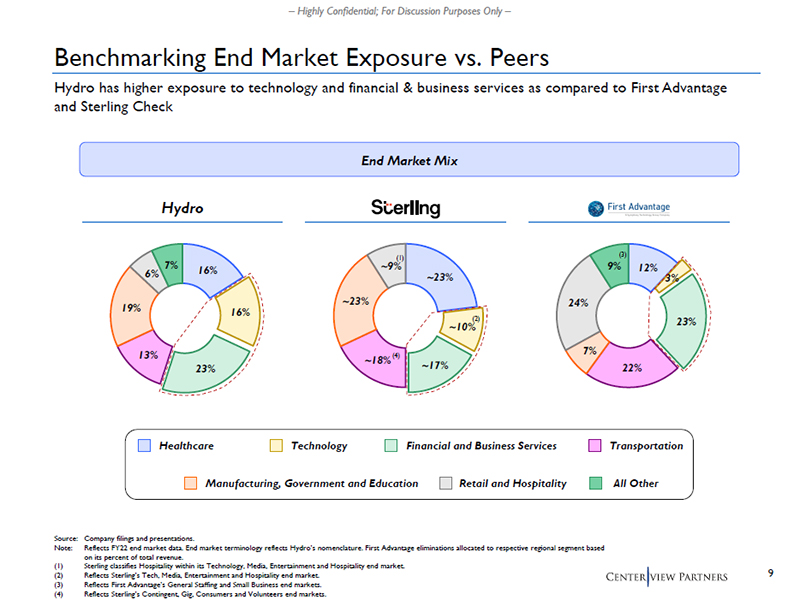
– Highly Confidential; For Discussion Purposes Only – 12% 3% 23% 22% 7% 24% 9% ~23% ~10% ~18% ~17% ~23% 16% ~9% 16% 23% 13% 19% 6% 7% Benchmarking End Market Exposure vs. Peers End Market Mix Hydro Healthcare Technology Financial and Business Services Transportation Manufacturing, Government and Education Retail and Hospitality All Other Source: Company filings and presentations. Note: Reflects FY22 end market data. End market terminology reflects Hydro’s nomenclature. First Advantage eliminations allocated to respective regional segment based on its percent of total revenue. (1) Sterling classifies Hospitality within its Technology, Media, Entertainment and Hospitality end market. (2) Reflects Sterling’s Tech, Media, Entertainment and Hospitality end market. (3) Reflects First Advantage’s General Staffing and Small Business end markets. (4) Reflects Sterling’s Contingent, Gig, Consumers and Volunteers end markets. (2) (4) (1) (3) Hydro has higher exposure to technology and financial & business services as compared to First Advantage and Sterling Check
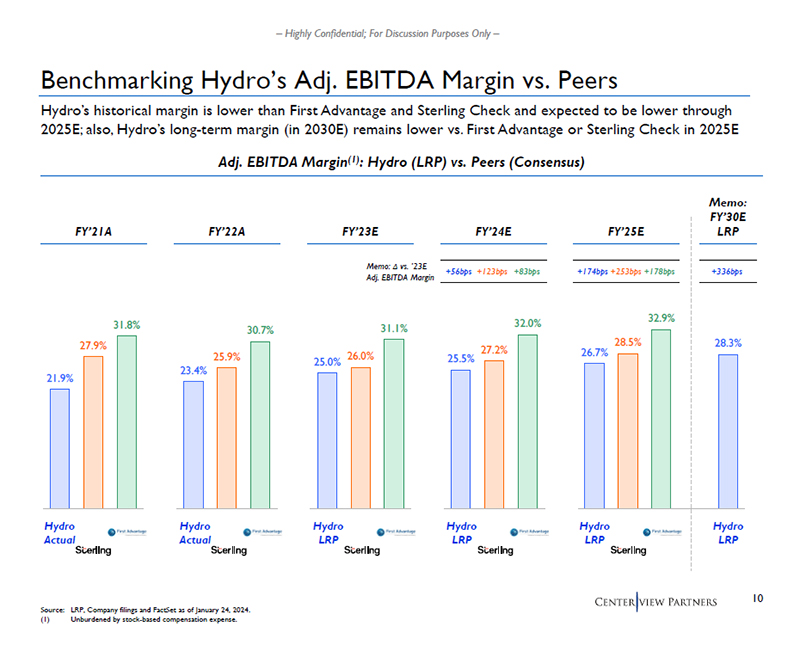
– Highly Confidential; For Discussion Purposes Only – 21.9% 27.9% 31.8% 23.4% 25.9% 30.7% 25.0% 26.0% 31.1% 25.5% 27.2% 32.0% 26.7% 28.5% 32.9% 28.3% Benchmarking Hydro’s Adj. EBITDA Margin vs. Peers Adj. EBITDA Margin(1): Hydro (LRP) vs. Peers (Consensus) FY’21A FY’22A FY’23E Memo: FY’30E LRP Memo: Δ vs. ’23E +56bps +123bps +83bps +174bps +253bps +178bps +336bps Adj. EBITDA Margin Source: LRP, Company filings and FactSet as of January 24, 2024. (1) Unburdened by stock-based compensation expense. Hydro’s historical margin is lower than First Advantage and Sterling Check and expected to be lower through 2025E; also, Hydro’s long-term margin (in 2030E) remains lower vs. First Advantage or Sterling Check in 2025E FY’24E FY’25E Hydro LRP Hydro Actual Hydro Actual Hydro LRP Hydro LRP Hydro LRP
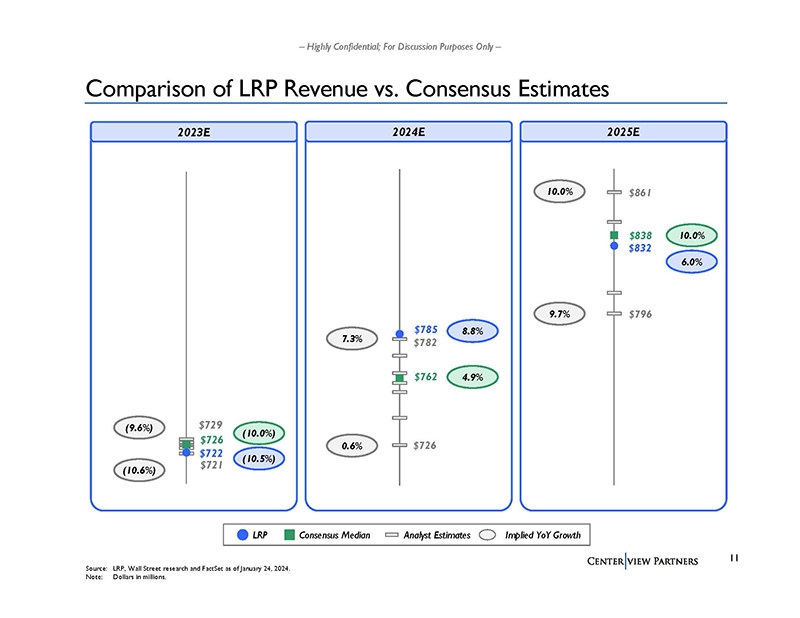
– Highly Confidential; For Discussion Purposes Only – 2023E 2024E Comparison of LRP Revenue vs. Consensus Estimates 4.9% 8.8% 7.3% Source: LRP, Wall Street research and FactSet as of January 24, 2024. Note: Dollars in millions. 0.6% $721 $729 $726 $722 $726 $782 $762 $785 $796 $861 $838 $832 2025E 10.0% 6.0% 9.7% 10.0% (9.6%) (10.0%) (10.5%) (10.6%) LRP Consensus Median Analyst Estimates Implied YoY Growth
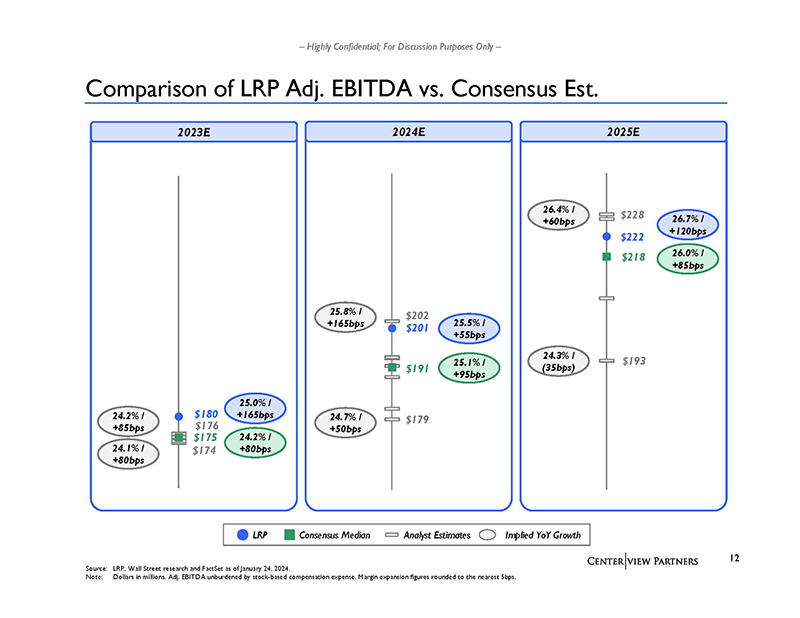
– Highly Confidential; For Discussion Purposes Only – 2023E 2024E Comparison of LRP Adj. EBITDA vs. Consensus Est. 2025E 24.2% / +85bps 24.2% / +80bps 25.0% / +165bps 24.1% / +80bps 25.8% / +165bps 25.1% / +95bps 25.5% / +55bps 24.7% / +50bps 26.0% / +85bps 26.7% / +120bps 24.3% / (35bps) 26.4% / +60bps Source: LRP, Wall Street research and FactSet as of January 24, 2024. Note: Dollars in millions. Adj. EBITDA unburdened by stock-based compensation expense. Margin expansion figures rounded to the nearest 5bps. LRP Consensus Median Analyst Estimates Implied YoY Growth $179 $202 $191 $201 $193 $228 $218 $222 $174 $176 $175 $180
Illustrative Valuation Analysis Section 2
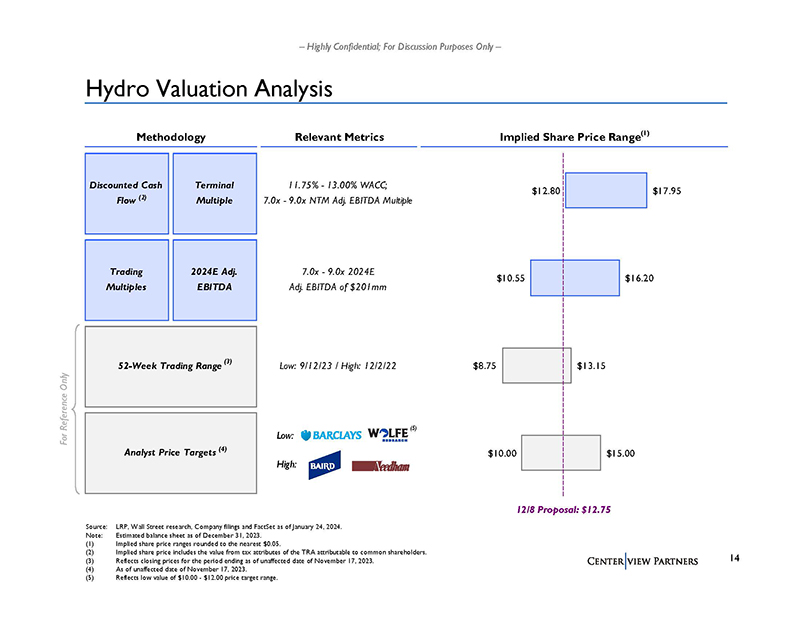
– Highly Confidential; For Discussion Purposes Only – Methodology Relevant Metrics Implied Share Price Range(1) 52-Week Trading Range Low: 9/12/23 / High: 12/2/22 Analyst Price Targets Discounted Cash Flow Terminal Multiple 11.75% - 13.00% WACC; 7.0x - 9.0x NTM Adj. EBITDA Multiple Trading Multiples 2024E Adj. EBITDA 7.0x - 9.0x 2024E Adj. EBITDA of $201mm $10.00 $8.75 $10.55 $12.80 $15.00 $13.15 $16.20 $17.95 Hydro Valuation Analysis Source: LRP, Wall Street research, Company filings and FactSet as of January 24, 2024. Note: Estimated balance sheet as of December 31, 2023. (1) Implied share price ranges rounded to the nearest $0.05. (2) Implied share price includes the value from tax attributes of the TRA attributable to common shareholders. (3) Reflects closing prices for the period ending as of unaffected date of November 17, 2023. (4) As of unaffected date of November 17, 2023. (5) Reflects low value of $10.00 - $12.00 price target range. For Reference Only (4) (3) 12/8 Proposal: $12.75 Low: High: (5) (2)
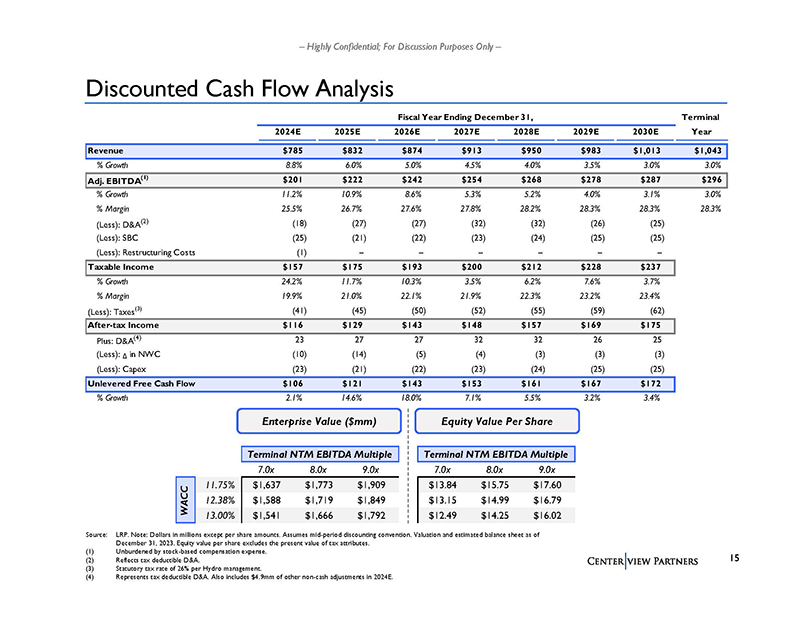
– Highly Confidential; For Discussion Purposes Only – Discounted Cash Flow Analysis Source: LRP. Note: Dollars in millions except per share amounts. Assumes mid-period discounting convention. Valuation and estimated balance sheet as of December 31, 2023. Equity value per share excludes the present value of tax attributes. (1) Unburdened by stock-based compensation expense. (2) Reflects tax deductible D&A. (3) Statutory tax rate of 26% per Hydro management. (4) Represents tax deductible D&A. Also includes $4.9mm of other non-cash adjustments in 2024E. Terminal NTM EBITDA Multiple Terminal NTM EBITDA Multiple 7.0x 8.0x 9.0x 7.0x 8.0x 9.0x 11.75% $1,637 $1,773 $1,909 $13.84 $15.75 $17.60 12.38% $1,588 $1,719 $1,849 $13.15 $14.99 $16.79 13.00% $1,541 $1,666 $1,792 $12.49 $14.25 $16.02 WACC Enterprise Value ($mm) Equity Value Per Share Fiscal Year Ending December 31, Terminal 2024E 2025E 2026E 2027E 2028E 2029E 2030E Year Revenue $785 $832 $874 $913 $950 $983 $1,013 $1,043 % Growth 8.8% 6.0% 5.0% 4.5% 4.0% 3.5% 3.0% 3.0% Adj. EBITDA(1) $201 $222 $242 $254 $268 $278 $287 $296 % Growth 11.2% 10.9% 8.6% 5.3% 5.2% 4.0% 3.1% 3.0% % Margin 25.5% 26.7% 27.6% 27.8% 28.2% 28.3% 28.3% 28.3% (Less): D&A(2) (18) (27) (27) (32) (32) (26) (25) (Less): SBC (25) (21) (22) (23) (24) (25) (25) (Less): Restructuring Costs (1) – – – – – – Taxable Income $157 $175 $193 $200 $212 $228 $237 % Growth 24.2% 11.7% 10.3% 3.5% 6.2% 7.6% 3.7% % Margin 19.9% 21.0% 22.1% 21.9% 22.3% 23.2% 23.4% (Less): Taxes(3) (41) (45) (50) (52) (55) (59) (62) After-tax Income $116 $129 $143 $148 $157 $169 $175 Plus: D&A(4) 23 27 27 32 32 26 25 (Less): Δ in NWC (10) (14) (5) (4) (3) (3) (3) (Less): Capex (23) (21) (22) (23) (24) (25) (25) Unlevered Free Cash Flow $106 $121 $143 $153 $161 $167 $172 % Growth 2.1% 14.6% 18.0% 7.1% 5.5% 3.2% 3.4%
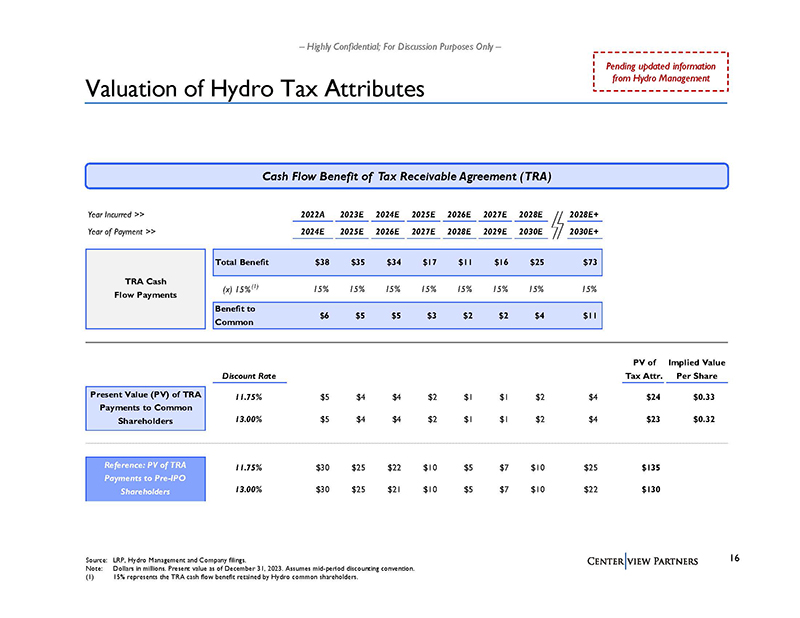
– Highly Confidential; For Discussion Purposes Only – Valuation of Hydro Tax Attributes Cash Flow Benefit of Tax Receivable Agreement (TRA) Source: LRP, Hydro Management and Company filings. Note: Dollars in millions. Present value as of December 31, 2023. Assumes mid-period discounting convention. (1) 15% represents the TRA cash flow benefit retained by Hydro common shareholders. Pending updated information from Hydro Management Year Incurred >> 2022A 2023E 2024E 2025E 2026E 2027E 2028E 2028E+ Year of Payment >> 2024E 2025E 2026E 2027E 2028E 2029E 2030E 2030E+ Total Benefit $38 $35 $34 $17 $11 $16 $25 $73 (x) 15%(1) 15% 15% 15% 15% 15% 15% 15% 15% Benefit to Common $6 $5 $5 $3 $2 $2 $4 $11 PV of Implied Value Discount Rate Tax Attr. Per Share 11.75% $5 $4 $4 $2 $1 $1 $2 $4 $24 $0.33 13.00% $5 $4 $4 $2 $1 $1 $2 $4 $23 $0.32 11.75% $30 $25 $22 $10 $5 $7 $10 $25 $135 13.00% $30 $25 $21 $10 $5 $7 $10 $22 $130 TRA Cash Flow Payments Reference: PV of TRA Payments to Pre-IPO Shareholders Present Value (PV) of TRA Payments to Common Shareholders
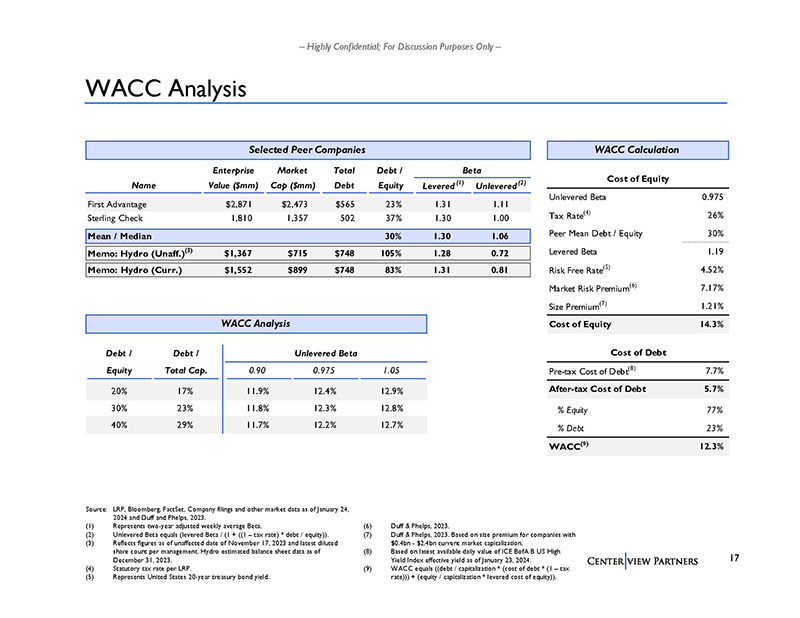
– Highly Confidential; For Discussion Purposes Only – Selected Peer Companies Enterprise Market Total Debt / Beta Name Value ($mm) Cap ($mm) Debt Equity Levered (1) Unlevered (2) First Advantage $2,871 $2,473 $565 23% 1.31 1.11 Sterling Check 1,810 1,357 502 37% 1.30 1.00 Mean / Median 30% 1.30 1.06 Memo: Hydro (Unaff.)(3) $1,367 $715 $748 105% 1.28 0.72 Memo: Hydro (Curr.) $1,552 $899 $748 83% 1.31 0.81 WACC Analysis Source: LRP, Bloomberg, FactSet, Company filings and other market data as of January 24, 2024 and Duff and Phelps, 2023. (1) Represents two-year adjusted weekly average Beta. (2) Unlevered Beta equals (levered Beta / (1 + ((1 – tax rate) * debt / equity)). (3) Reflects figures as of unaffected date of November 17, 2023 and latest diluted share count per management. Hydro estimated balance sheet data as of December 31, 2023. (4) Statutory tax rate per LRP. (5) Represents United States 20-year treasury bond yield. (6) Duff & Phelps, 2023. (7) Duff & Phelps, 2023. Based on size premium for companies with $0.4bn - $2.4bn current market capitalization. (8) Based on latest available daily value of ICE BofA B US High Yield Index effective yield as of January 23, 2024. (9) WACC equals ((debt / capitalization * (cost of debt * (1 – tax rate))) + (equity / capitalization * levered cost of equity)). WACC Calculation Cost of Equity Unlevered Beta 0.975 Tax Rate(4) 26% Peer Mean Debt / Equity 30% Levered Beta 1.19 Risk Free Rate(5) 4.52% Market Risk Premium(6) 7.17% Size Premium(7) 1.21% Cost of Equity 14.3% Cost of Debt Pre-tax Cost of Debt(8) 7.7% After-tax Cost of Debt 5.7% % Equity 77% % Debt 23% WACC(9) 12.3% WACC Analysis Debt / Debt / Unlevered Beta Equity Total Cap. 0.90 0.975 1.05 20% 17% 11.9% 12.4% 12.9% 30% 23% 11.8% 12.3% 12.8% 40% 29% 11.7% 12.2% 12.7%
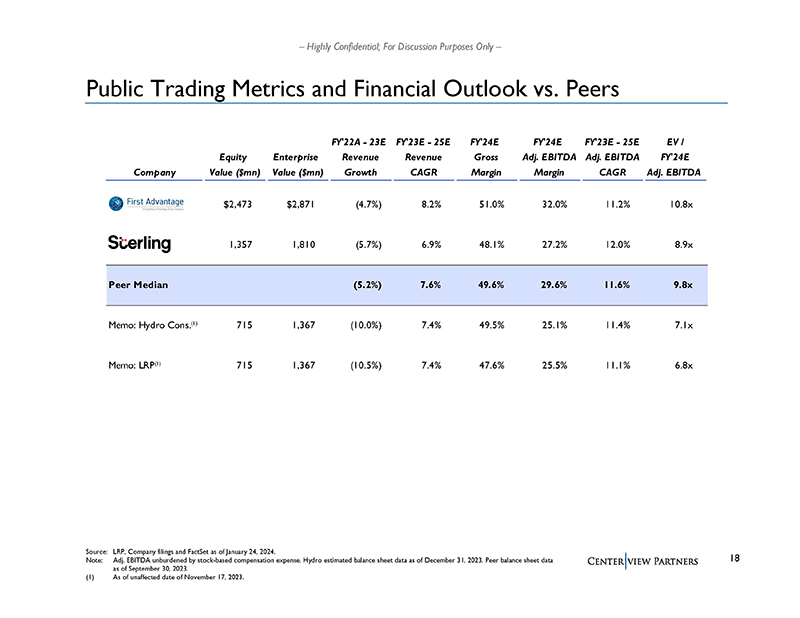
– Highly Confidential; For Discussion Purposes Only – FY'22A - 23E FY'23E - 25E FY'24E FY'24E FY'23E - 25E EV / Equity Enterprise Revenue Revenue Gross Adj. EBITDA Adj. EBITDA FY'24E Company Value ($mn) Value ($mn) Growth CAGR Margin Margin CAGR Adj. EBITDA $2,473 $2,871 (4.7%) 8.2% 51.0% 32.0% 11.2% 10.8x 1,357 1,810 (5.7%) 6.9% 48.1% 27.2% 12.0% 8.9x Peer Median (5.2%) 7.6% 49.6% 29.6% 11.6% 9.8x Memo: Hydro Cons.(1) 715 1,367 (10.0%) 7.4% 49.5% 25.1% 11.4% 7.1x Memo: LRP(1) 715 1,367 (10.5%) 7.4% 47.6% 25.5% 11.1% 6.8x Public Trading Metrics and Financial Outlook vs. Peers Source: LRP, Company filings and FactSet as of January 24, 2024. Note: Adj. EBITDA unburdened by stock-based compensation expense. Hydro estimated balance sheet data as of December 31, 2023. Peer balance sheet data as of September 30, 2023. (1) As of unaffected date of November 17, 2023.
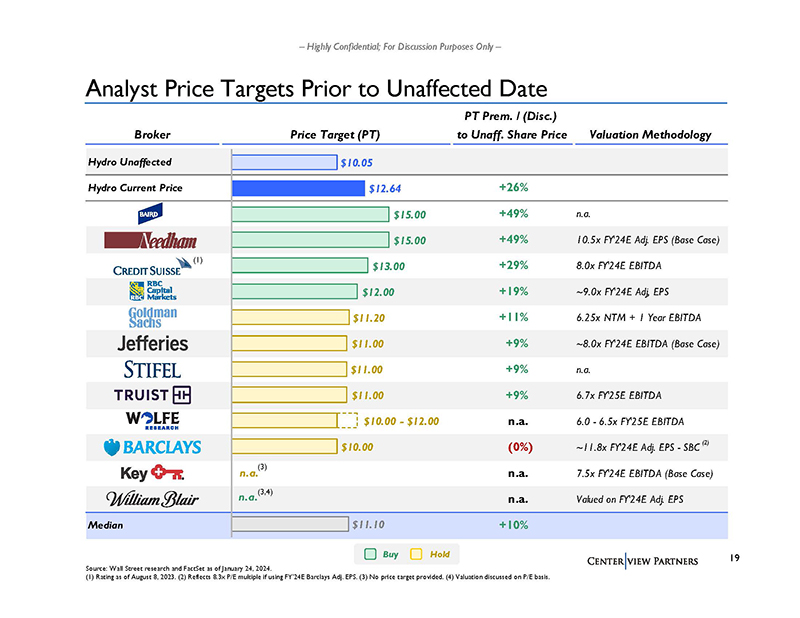
– Highly Confidential; For Discussion Purposes Only – PT Prem. / (Disc.) Broker Price Target (PT) to Unaff. Share Price Valuation Methodology Hydro Unaffected Hydro Current Price +26% +49% n.a. +49% 10.5x FY'24E Adj. EPS (Base Case) +29% 8.0x FY'24E EBITDA +19% ~9.0x FY'24E Adj, EPS +11% 6.25x NTM + 1 Year EBITDA +9% ~8.0x FY'24E EBITDA (Base Case) +9% n.a. +9% 6.7x FY'25E EBITDA n.a. 6.0 - 6.5x FY'25E EBITDA (0%) ~11.8x FY'24E Adj. EPS - SBC n.a. 7.5x FY'24E EBITDA (Base Case) n.a. Valued on FY'24E Adj. EPS Median +10% $10.05 $12.64 $15.00 $15.00 $13.00 $12.00 $11.20 $11.00 $11.00 $11.00 $10.00 - $12.00 $10.00 n.a. n.a. $11.10 Analyst Price Targets Prior to Unaffected Date Source: Wall Street research and FactSet as of January 24, 2024. (1) Rating as of August 8, 2023. (2) Reflects 8.3x P/E multiple if using FY’24E Barclays Adj. EPS. (3) No price target provided. (4) Valuation discussed on P/E basis. Buy Hold (3) (3,4) (1) (2)

Selected Precedents and Next Steps Section 3
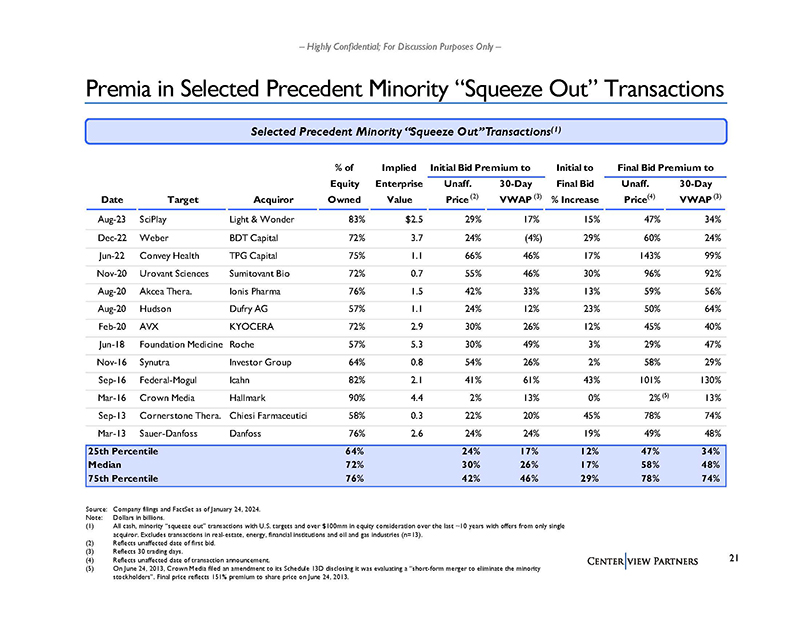
– Highly Confidential; For Discussion Purposes Only – Premia in Selected Precedent Minority “Squeeze Out” Transactions Selected Precedent Minority “Squeeze Out” Transactions(1) Source: Company filings and FactSet as of January 24, 2024. Note: Dollars in billions. (1) All cash, minority “squeeze out” transactions with U.S. targets and over $100mm in equity consideration over the last ~10 years with offers from only single acquiror. Excludes transactions in real-estate, energy, financial institutions and oil and gas industries (n=13). (2) Reflects unaffected date of first bid. (3) Reflects 30 trading days. (4) Reflects unaffected date of transaction announcement. (5) On June 24, 2013, Crown Media filed an amendment to its Schedule 13D disclosing it was evaluating a “short-form merger to eliminate the minority stockholders”. Final price reflects 151% premium to share price on June 24, 2013. % of Implied Initial Bid Premium to Initial to Final Bid Premium to Equity Enterprise Unaff. 30-Day Final Bid Unaff. 30-Day Date Target Acquiror Owned Value Price VWAP % Increase Price VWAP Aug-23 SciPlay Light & Wonder 83% $2.5 29% 17% 15% 47% 34% Dec-22 Weber BDT Capital 72% 3.7 24% (4%) 29% 60% 24% Jun-22 Convey Health TPG Capital 75% 1.1 66% 46% 17% 143% 99% Nov-20 Urovant Sciences Sumitovant Bio 72% 0.7 55% 46% 30% 96% 92% Aug-20 Akcea Thera. Ionis Pharma 76% 1.5 42% 33% 13% 59% 56% Aug-20 Hudson Dufry AG 57% 1.1 24% 12% 23% 50% 64% Feb-20 AVX KYOCERA 72% 2.9 30% 26% 12% 45% 40% Jun-18 Foundation Medicine Roche 57% 5.3 30% 49% 3% 29% 47% Nov-16 Synutra Investor Group 64% 0.8 54% 26% 2% 58% 29% Sep-16 Federal-Mogul Icahn 82% 2.1 41% 61% 43% 101% 130% Mar-16 Crown Media Hallmark 90% 4.4 2% 13% 0% 2% 13% Sep-13 Cornerstone Thera. Chiesi Farmaceutici 58% 0.3 22% 20% 45% 78% 74% Mar-13 Sauer-Danfoss Danfoss 76% 2.6 24% 24% 19% 49% 48% 25th Percentile 64% 24% 17% 12% 47% 34% Median 72% 30% 26% 17% 58% 48% 75th Percentile 76% 42% 46% 29% 78% 74% (5) (2) (3) (4) (3)
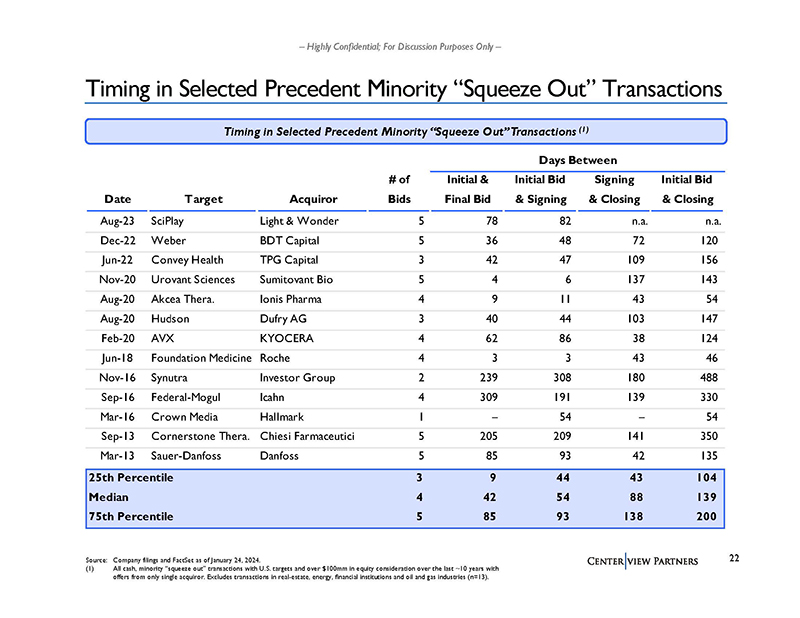
– Highly Confidential; For Discussion Purposes Only – Timing in Selected Precedent Minority “Squeeze Out” Transactions Timing in Selected Precedent Minority “Squeeze Out” Transactions (1) Source: Company filings and FactSet as of January 24, 2024. (1) All cash, minority “squeeze out” transactions with U.S. targets and over $100mm in equity consideration over the last ~10 years with offers from only single acquiror. Excludes transactions in real-estate, energy, financial institutions and oil and gas industries (n=13). Days Between # of Initial & Initial Bid Signing Initial Bid Date Target Acquiror Bids Final Bid & Signing & Closing & Closing Aug-23 SciPlay Light & Wonder 5 78 82 n.a. n.a. Dec-22 Weber BDT Capital 5 36 48 72 120 Jun-22 Convey Health TPG Capital 3 42 47 109 156 Nov-20 Urovant Sciences Sumitovant Bio 5 4 6 137 143 Aug-20 Akcea Thera. Ionis Pharma 4 9 11 43 54 Aug-20 Hudson Dufry AG 3 40 44 103 147 Feb-20 AVX KYOCERA 4 62 86 38 124 Jun-18 Foundation Medicine Roche 4 3 3 43 46 Nov-16 Synutra Investor Group 2 239 308 180 488 Sep-16 Federal-Mogul Icahn 4 309 191 139 330 Mar-16 Crown Media Hallmark 1 – 54 – 54 Sep-13 Cornerstone Thera. Chiesi Farmaceutici 5 205 209 141 350 Mar-13 Sauer-Danfoss Danfoss 5 85 93 42 135 25th Percentile 3 9 44 43 104 Median 4 42 54 88 139 75th Percentile 5 85 93 138 200
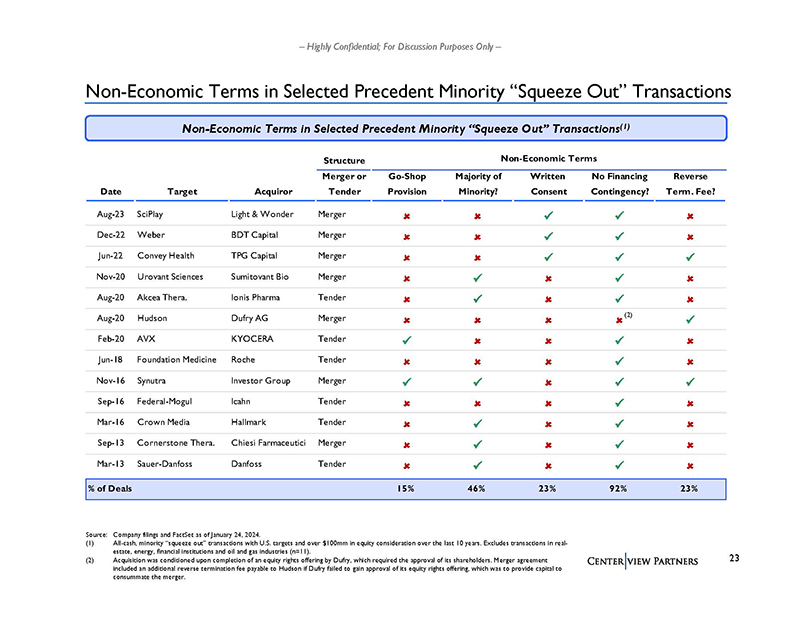
– Highly Confidential; For Discussion Purposes Only – Non-Economic Terms in Selected Precedent Minority “Squeeze Out” Transactions Non-Economic Terms in Selected Precedent Minority “Squeeze Out” Transactions(1) Source: Company filings and FactSet as of January 24, 2024. (1) All-cash, minority “squeeze out” transactions with U.S. targets and over $100mm in equity consideration over the last 10 years. Excludes transactions in realestate, energy, financial institutions and oil and gas industries (n=11). (2) Acquisition was conditioned upon completion of an equity rights offering by Dufry, which required the approval of its shareholders. Merger agreement included an additional reverse termination fee payable to Hudson if Dufry failed to gain approval of its equity rights offering, which was to provide capital to consummate the merger. Structure Non-Economic Terms Merger or Go-Shop Majority of Written No Financing Reverse Date Target Acquiror Tender Provision Minority? Consent Contingency? Term. Fee? Aug-23 SciPlay Light & Wonder Merger Dec-22 Weber BDT Capital Merger Jun-22 Convey Health TPG Capital Merger Nov-20 Urovant Sciences Sumitovant Bio Merger Aug-20 Akcea Thera. Ionis Pharma Tender Aug-20 Hudson Dufry AG Merger Feb-20 AVX KYOCERA Tender Jun-18 Foundation Medicine Roche Tender Nov-16 Synutra Investor Group Merger Sep-16 Federal-Mogul Icahn Tender Mar-16 Crown Media Hallmark Tender Sep-13 Cornerstone Thera. Chiesi Farmaceutici Merger Mar-13 Sauer-Danfoss Danfoss Tender % of Deals 15% 46% 23% 92% 23% (2)
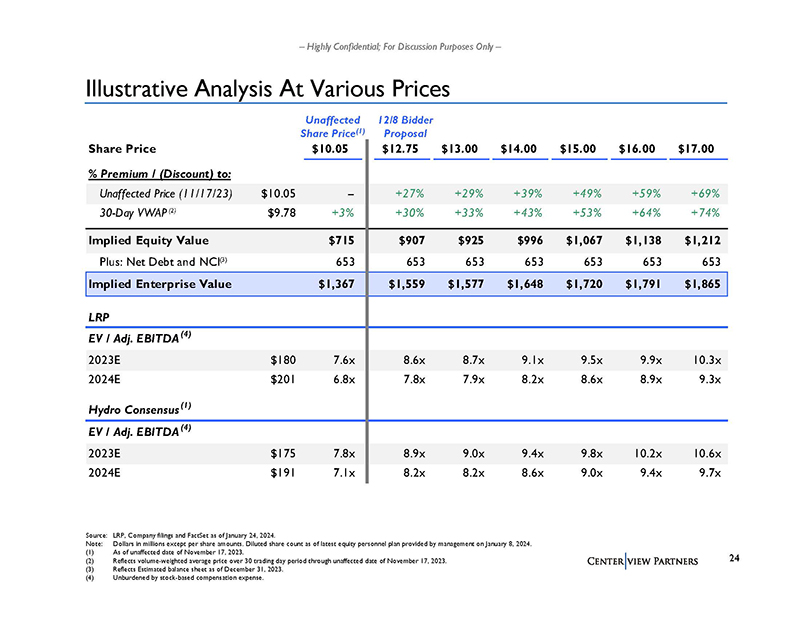
– Highly Confidential; For Discussion Purposes Only – Illustrative Analysis At Various Prices 12/8 Bidder Proposal Source: LRP, Company filings and FactSet as of January 24, 2024. Note: Dollars in millions except per share amounts. Diluted share count as of latest equity personnel plan provided by management on January 8, 2024. (1) As of unaffected date of November 17, 2023. (2) Reflects volume-weighted average price over 30 trading day period through unaffected date of November 17, 2023. (3) Reflects Estimated balance sheet as of December 31, 2023. (4) Unburdened by stock-based compensation expense. Unaffected Share Price(1) Share Price $10.05 $12.75 $13.00 $14.00 $15.00 $16.00 $17.00 % Premium / (Discount) to: Unaffected Price (11/17/23) $10.05 -- +27% +29% +39% +49% +59% +69% 30-Day VWAP (2) $9.78 +3% +30% +33% +43% +53% +64% +74% Implied Equity Value $715 $907 $925 $996 $1,067 $1,138 $1,212 Plus: Net Debt and NCI(3) 653 653 653 653 653 653 653 Implied Enterprise Value $1,367 $1,559 $1,577 $1,648 $1,720 $1,791 $1,865 LRP EV / Adj. EBITDA(4) 2023E $180 7.6x 8.6x 8.7x 9.1x 9.5x 9.9x 10.3x 2024E $201 6.8x 7.8x 7.9x 8.2x 8.6x 8.9x 9.3x Hydro Consensus (1) EV / Adj. EBITDA(4) 2023E $175 7.8x 8.9x 9.0x 9.4x 9.8x 10.2x 10.6x 2024E $191 7.1x 8.2x 8.2x 8.6x 9.0x 9.4x 9.7x
– Highly Confidential; For Discussion Purposes Only – Next Steps ▪ Discuss and align on response to Bidders
Appendix Supporting Materials
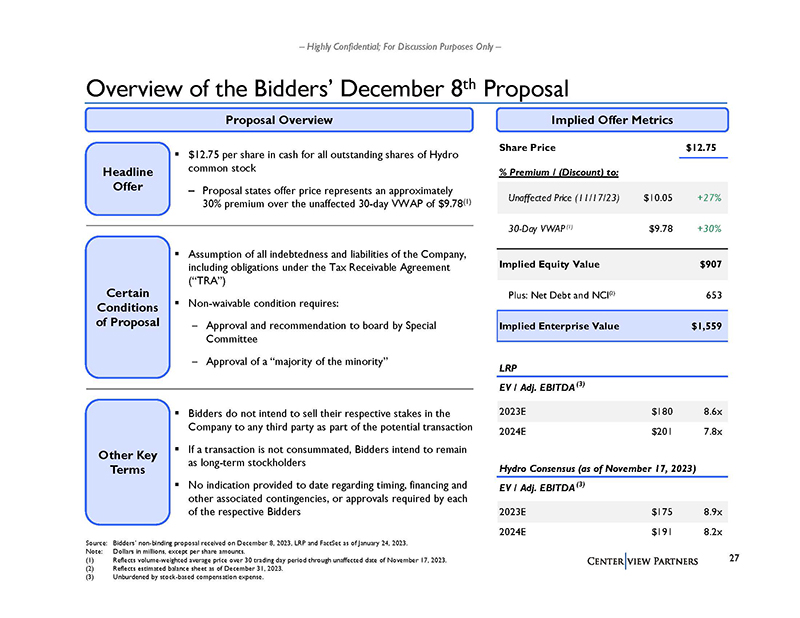
– Highly Confidential; For Discussion Purposes Only – Overview of the Bidders’ December 8th Proposal ▪ $12.75 per share in cash for all outstanding shares of Hydro common stock – Proposal states offer price represents an approximately 30% premium over the unaffected 30-day VWAP of $9.78(1) Headline Offer ▪ Assumption of all indebtedness and liabilities of the Company, including obligations under the Tax Receivable Agreement (“TRA”) ▪ Non-waivable condition requires: – Approval and recommendation to board by Special Committee – Approval of a “majority of the minority” ▪ Bidders do not intend to sell their respective stakes in the Company to any third party as part of the potential transaction ▪ If a transaction is not consummated, Bidders intend to remain as long-term stockholders ▪ No indication provided to date regarding timing, financing and other associated contingencies, or approvals required by each of the respective Bidders Other Key Terms Certain Conditions of Proposal Proposal Overview Implied Offer Metrics Source: Bidders’ non-binding proposal received on December 8, 2023, LRP and FactSet as of January 24, 2023. Note: Dollars in millions, except per share amounts. (1) Reflects volume-weighted average price over 30 trading day period through unaffected date of November 17, 2023. (2) Reflects estimated balance sheet as of December 31, 2023. (3) Unburdened by stock-based compensation expense. Share Price $12.75 % Premium / (Discount) to: Unaffected Price (11/17/23) $10.05 +27% 30-Day VWAP (1) $9.78 +30% Implied Equity Value $907 Plus: Net Debt and NCI(2) 653 Implied Enterprise Value $1,559 LRP EV / Adj. EBITDA(3) 2023E $180 8.6x 2024E $201 7.8x Hydro Consensus (as of November 17, 2023) EV / Adj. EBITDA(3) 2023E $175 8.9x 2024E $191 8.2x
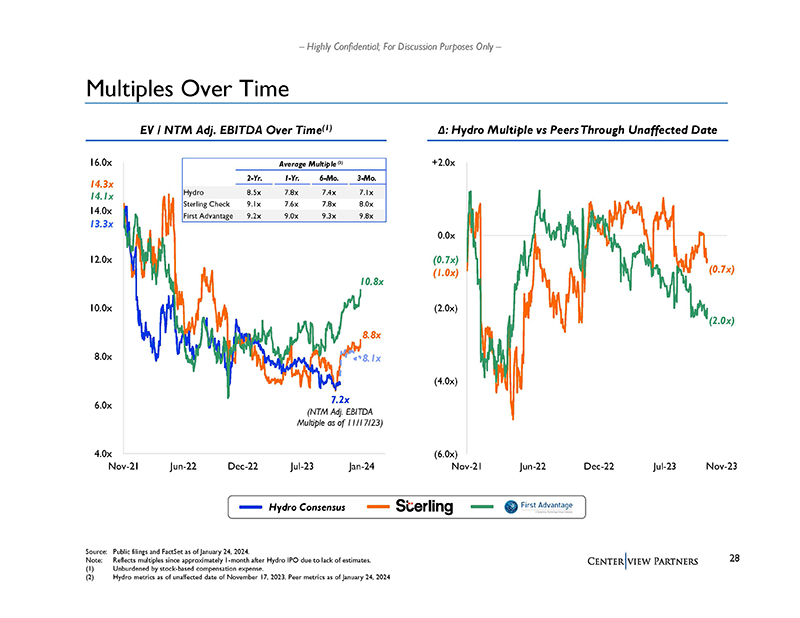
– Highly Confidential; For Discussion Purposes Only – 4.0x 6.0x 8.0x 10.0x 12.0x 14.0x 16.0x Nov-21 Jun-22 Dec-22 Jul-23 Jan-24 Average Multiple (3) 2-Yr. 1-Yr. 6-Mo. 3-Mo. Hydro 8.5x 7.8x 7.4x 7.1x Sterling Check 9.1x 7.6x 7.8x 8.0x First Advantage 9.2x 9.0x 9.3x 9.8x Multiples Over Time Source: Public filings and FactSet as of January 24, 2024. Note: Reflects multiples since approximately 1-month after Hydro IPO due to lack of estimates. (1) Unburdened by stock-based compensation expense. (2) Hydro metrics as of unaffected date of November 17, 2023. Peer metrics as of January 24, 2024 7.2x 10.8x (NTM Adj. EBITDA Multiple as of 11/17/23) 8.1x 14.3x 13.3x Hydro Consensus 14.1x 8.8x EV / NTM Adj. EBITDA Over Time(1) Δ: Hydro Multiple vs Peers Through Unaffected Date (6.0x) (4.0x) (2.0x) 0.0x +2.0x Nov-21 Jun-22 Dec-22 Jul-23 (2.0x) (1.0x) (0.7x) (0.7x) Nov-23
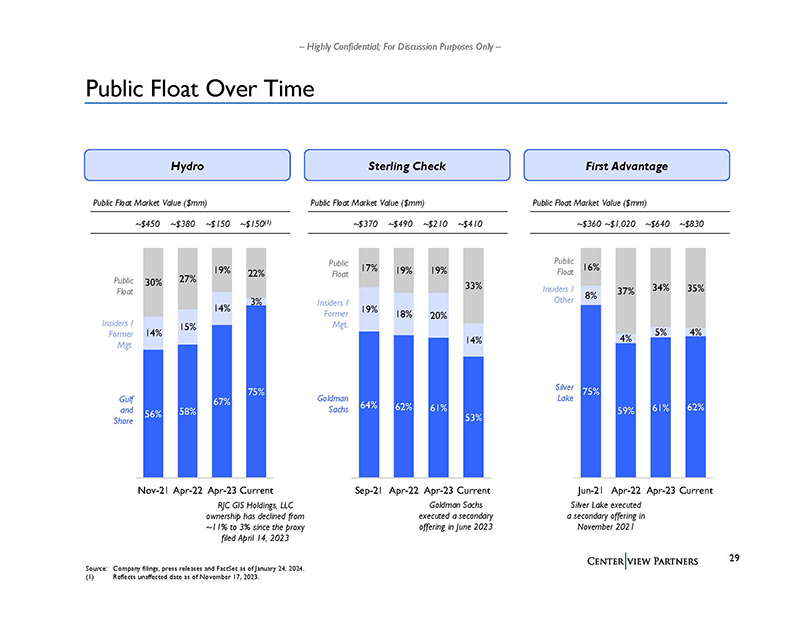
– Highly Confidential; For Discussion Purposes Only – 56% 58% 67% 75% 14% 15% 14% 3% 30% 27% 19% 22% Nov-21 Apr-22 Apr-23 Current 75% 59% 61% 62% 8% 4% 5% 4% 16% 37% 34% 35% Jun-21 Apr-22 Apr-23 Current 64% 62% 61% 53% 19% 18% 20% 14% 17% 19% 19% 33% Sep-21 Apr-22 Apr-23 Current Public Float Over Time Source: Company filings, press releases and FactSet as of January 24, 2024. (1) Reflects unaffected date as of November 17, 2023. Hydro Goldman Sachs Gulf and Shore Insiders / Former Mgt. Public Float First Advantage Silver Lake Insiders / Other Public Float Sterling Check Insiders / Former Mgt. Public Float Goldman Sachs executed a secondary offering in June 2023 ~$150(1) Public Float Market Value ($mm) ~$450 ~$380 ~$150 ~$410 Public Float Market Value ($mm) ~$370 ~$490 ~$210 ~$830 Public Float Market Value ($mm) ~$360 ~$1,020 ~$640 Silver Lake executed a secondary offering in November 2021 RJC GIS Holdings, LLC ownership has declined from ~11% to 3% since the proxy filed April 14, 2023
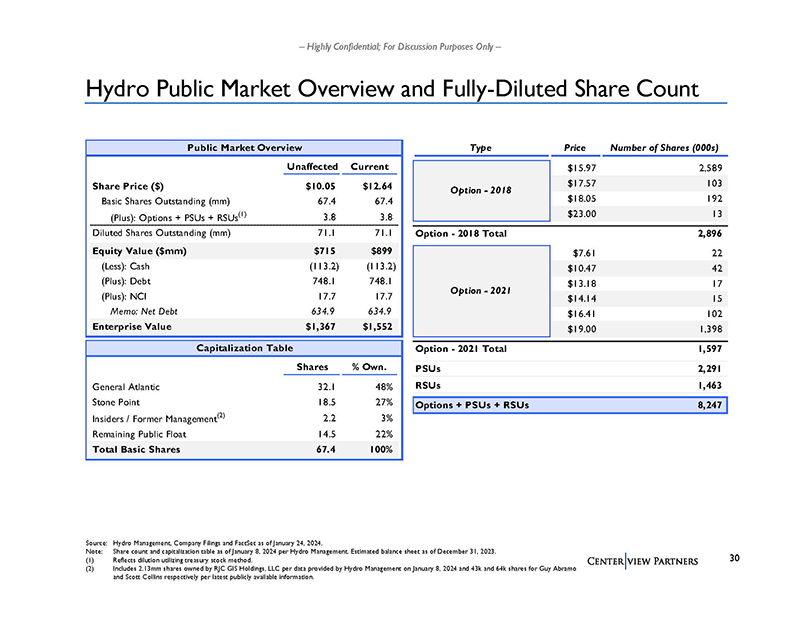
– Highly Confidential; For Discussion Purposes Only – Hydro Public Market Overview and Fully-Diluted Share Count Source: Hydro Management, Company Filings and FactSet as of January 24, 2024. Note: Share count and capitalization table as of January 8, 2024 per Hydro Management. Estimated balance sheet as of December 31, 2023. (1) Reflects dilution utilizing treasury stock method. (2) Includes 2.13mm shares owned by RJC GIS Holdings, LLC per data provided by Hydro Management on January 8, 2024 and 43k and 64k shares for Guy Abramo and Scott Collins respectively per latest publicly available information. Public Market Overview Unaffected Current Share Price ($) $10.05 $12.64 Basic Shares Outstanding (mm) 67.4 67.4 (Plus): Options + PSUs + RSUs(1) 3.8 3.8 Diluted Shares Outstanding (mm) 71.1 71.1 Equity Value ($mm) $715 $899 (Less): Cash (113.2) (113.2) (Plus): Debt 748.1 748.1 (Plus): NCI 17.7 17.7 Memo: Net Debt 634.9 634.9 Enterprise Value $1,367 $1,552 Type Price Number of Shares (000s) $15.97 2,589 $17.57 103 $18.05 192 $23.00 13 Option - 2018 Total 2,896 $7.61 22 $10.47 42 $13.18 17 $14.14 15 $16.41 102 $19.00 1,398 Option - 2021 Total 1,597 PSUs 2,291 RSUs 1,463 Options + PSUs + RSUs 8,247 Option - 2018 Option - 2021 Capitalization Table Shares % Own. General Atlantic 32.1 48% Stone Point 18.5 27% Insiders / Former Management(2) 2.2 3% Remaining Public Float 14.5 22% Total Basic Shares 67.4 100%
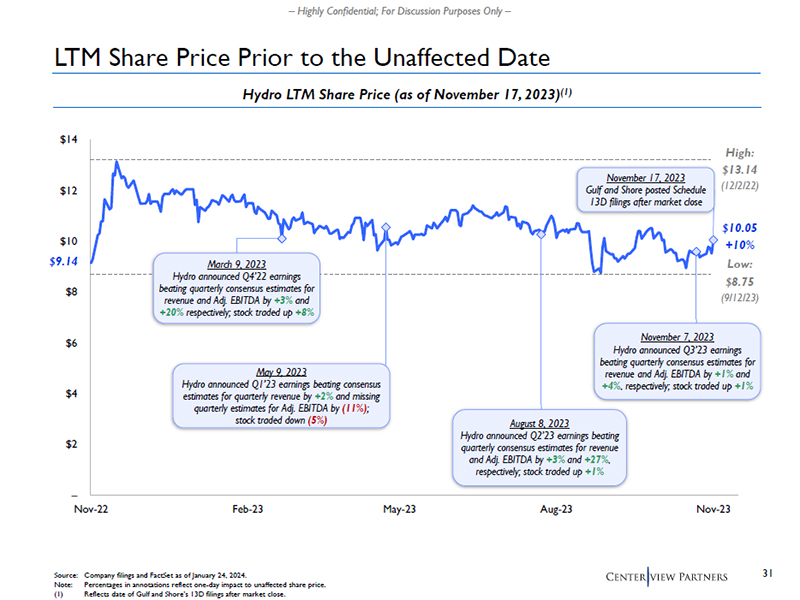
– Highly Confidential; For Discussion Purposes Only – – $2 $4 $6 $8 $10 $12 $14 Nov-22 Feb-23 May-23 Aug-23 Nov-23 LTM Share Price Prior to the Unaffected Date Hydro LTM Share Price (as of November 17, 2023)(1) August 8, 2023 Hydro announced Q2’23 earnings beating quarterly consensus estimates for revenue and Adj. EBITDA by +3% and +27%, respectively; stock traded up +1% November 7, 2023 Hydro announced Q3’23 earnings beating quarterly consensus estimates for revenue and Adj. EBITDA by +1% and +4%, respectively; stock traded up +1% Source: Company filings and FactSet as of January 24, 2024. Note: Percentages in annotations reflect one-day impact to unaffected share price. (1) Reflects date of Gulf and Shore’s 13D filings after market close. $9.14 November 17, 2023 Gulf and Shore posted Schedule 13D filings after market close March 9, 2023 Hydro announced Q4’22 earnings beating quarterly consensus estimates for revenue and Adj. EBITDA by +3% and +20% respectively; stock traded up +8% +10% $10.05 $13.14 High: (12/2/22) $8.75 Low: (9/12/23) May 9, 2023 Hydro announced Q1’23 earnings beating consensus estimates for quarterly revenue by +2% and missing quarterly estimates for Adj. EBITDA by (11%); stock traded down (5%)