Exhibit c(v)
– Highly Confidential Draft; For Discussion Purposes Only – February 15, 2024 Discussion Materials for the Special Committee Project Hydro
– Highly Confidential Draft; For Discussion Purposes Only – Disclaimer This presentation has been prepared by Centerview
Partners LLC (“Centerview”) for use solely by the Special Committee of the Board of Directors of HireRight Holdings
Corporation (“Hydro”, the “Company” or the “Special Committee”) in connection with its evaluation
of proposed strategic alternatives for Hydro and for no other purpose. The information contained herein is based upon information
supplied by or on behalf of Hydro and publicly available information, and portions of the information contained herein may be
based upon statements, estimates and forecasts provided by Hydro. Centerview has relied upon the accuracy and completeness of
the foregoing information, and has not assumed any responsibility for any independent verification of such information or for
any independent evaluation or appraisal of any of the assets or liabilities (contingent or otherwise) of Hydro or any other entity,
or concerning the solvency or fair value of Hydro or any other entity. Any financial analysis in this presentation is complex
and is not necessarily susceptible to a partial analysis or summary description. In performing any financial analysis, Centerview
has considered the results of its analysis as a whole and did not necessarily attribute a particular weight to any particular
portion of the analysis considered. Furthermore, selecting any portion of Centerview’s analysis, without considering the
analysis as a whole, would create an incomplete view of the process underlying its financial analysis. Centerview may have deemed
various assumptions more or less probable than other assumptions, so the reference ranges resulting from any particular portion
of the analysis described above should not be taken to be Centerview’s view of the actual value of Hydro. These materials
and the information contained herein are confidential, were not prepared with a view toward public disclosure, and may not be
disclosed publicly or made available to third parties without the prior written consent of Centerview. These materials and any
other advice, written or oral, rendered by Centerview are intended solely for the benefit and use of the Special Committee of
the Board of Directors of Hydro (in its capacity as such) in its consideration of strategic alternatives, and are not for the
benefit of, and do not convey any rights or remedies for any holder of securities of Hydro or any other person. Centerview will
not be responsible for and has not provided any tax, accounting, actuarial, legal or other specialist advice. These materials
are not intended to provide the sole basis for evaluating strategic alternatives, and this presentation does not represent a fairness
opinion, recommendation, valuation or opinion of any kind, and is necessarily incomplete and should be viewed solely in conjunction
with the oral presentation provided by Centerview.
–
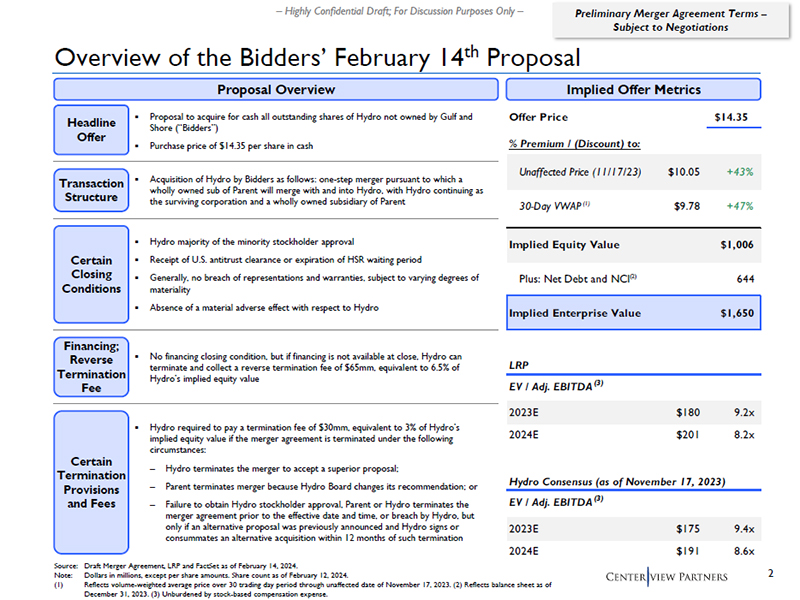
Highly Confidential Draft; For Discussion Purposes Only – Overview of the Bidders’ February 14th Proposal Proposal
Overview Implied Offer Metrics Source: Draft Merger Agreement, LRP and FactSet as of February 14, 2024. Note: Dollars in millions,
except per share amounts. Share count as of February 12, 2024. (1) Reflects volume-weighted average price over 30 trading day
period through unaffected date of November 17, 2023. (2) Reflects balance sheet as of December 31, 2023. (3) Unburdened by stock-based
compensation expense. Offer Price $14.35 % Premium / (Discount) to: Unaffected Price (11/17/23) $10.05 +43% 30-Day VWAP (1) $9.78
+47% Implied Equity Value $1,006 Plus: Net Debt and NCI(2) 644 Implied Enterprise Value $1,650 LRP EV / Adj. EBITDA(3) 2023E $180
9.2x 2024E $201 8.2x Hydro Consensus (as of November 17, 2023) EV / Adj. EBITDA(3) 2023E $175 9.4x 2024E $191 8.6x Preliminary
Merger Agreement Terms – Subject to Negotiations ▪ Proposal to acquire for cash all outstanding shares of Hydro not
owned by Gulf and Shore (“Bidders”) ▪ Purchase price of $14.35 per share in cash Headline Offer ▪ Acquisition
of Hydro by Bidders as follows: one-step merger pursuant to which a wholly owned sub of Parent will merge with and into Hydro,
with Hydro continuing as the surviving corporation and a wholly owned subsidiary of Parent Transaction Structure Certain Closing
Conditions ▪ Hydro required to pay a termination fee of $30mm, equivalent to 3% of Hydro’s implied equity value if
the merger agreement is terminated under the following circumstances: – Hydro terminates the merger to accept a superior
proposal; – Parent terminates merger because Hydro Board changes its recommendation; or – Failure to obtain Hydro
stockholder approval, Parent or Hydro terminates the merger agreement prior to the effective date and time, or breach by Hydro,
but only if an alternative proposal was previously announced and Hydro signs or consummates an alternative acquisition within
12 months of such termination Certain Termination Provisions and Fees ▪ Hydro majority of the minority stockholder approval
▪ Receipt of U.S. antitrust clearance or expiration of HSR waiting period ▪ Generally, no breach of representations
and warranties, subject to varying degrees of materiality ▪ Absence of a material adverse effect with respect to Hydro Financing;
Reverse Termination Fee ▪ No financing closing condition, but if financing is not available at close, Hydro can terminate
and collect a reverse termination fee of $65mm, equivalent to 6.5% of Hydro’s implied equity value
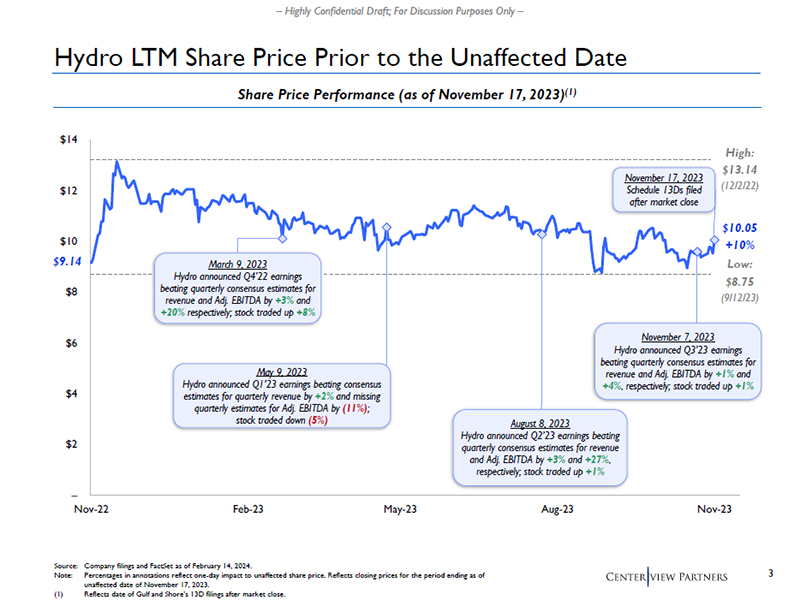
– Highly Confidential Draft; For Discussion Purposes Only – – $2 $4 $6 $8 $10 $12 $14 Nov-22 Feb-23 May-23 Aug-23 Nov-23 Hydro LTM Share Price Prior to the Unaffected Date Share Price Performance (as of November 17, 2023)(1) August 8, 2023 Hydro announced Q2’23 earnings beating quarterly consensus estimates for revenue and Adj. EBITDA by +3% and +27%, respectively; stock traded up +1% November 7, 2023 Hydro announced Q3’23 earnings beating quarterly consensus estimates for revenue and Adj. EBITDA by +1% and +4%, respectively; stock traded up +1% Source: Company filings and FactSet as of February 14, 2024. Note: Percentages in annotations reflect one-day impact to unaffected share price. Reflects closing prices for the period ending as of unaffected date of November 17, 2023. (1) Reflects date of Gulf and Shore’s 13D filings after market close. $9.14 November 17, 2023 Schedule 13Ds filed after market close March 9, 2023 Hydro announced Q4’22 earnings beating quarterly consensus estimates for revenue and Adj. EBITDA by +3% and +20% respectively; stock traded up +8% +10% $10.05 $13.14 High: (12/2/22) $8.75 Low: (9/12/23) May 9, 2023 Hydro announced Q1’23 earnings beating consensus estimates for quarterly revenue by +2% and missing quarterly estimates for Adj. EBITDA by (11%); stock traded down (5%)
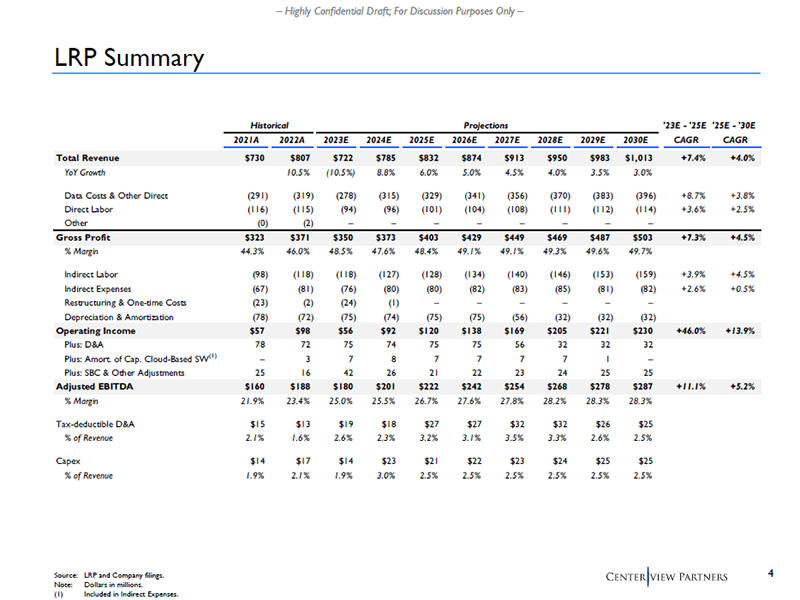
– Highly Confidential Draft; For Discussion Purposes Only – LRP Summary Source: LRP and Company filings. Note: Dollars in millions. (1) Included in Indirect Expenses. Historical Projections '23E - '25E '25E - '30E 2021A 2022A 2023E 2024E 2025E 2026E 2027E 2028E 2029E 2030E CAGR CAGR Total Revenue $730 $807 $722 $785 $832 $874 $913 $950 $983 $1,013 +7.4% +4.0% YoY Growth 10.5% (10.5%) 8.8% 6.0% 5.0% 4.5% 4.0% 3.5% 3.0% Data Costs & Other Direct (291) (319) (278) (315) (329) (341) (356) (370) (383) (396) +8.7% +3.8% Direct Labor (116) (115) (94) (96) (101) (104) (108) (111) (112) (114) +3.6% +2.5% Other (0) (2) – – – – – – – – Gross Profit $323 $371 $350 $373 $403 $429 $449 $469 $487 $503 +7.3% +4.5% % Margin 44.3% 46.0% 48.5% 47.6% 48.4% 49.1% 49.1% 49.3% 49.6% 49.7% Indirect Labor (98) (118) (118) (127) (128) (134) (140) (146) (153) (159) +3.9% +4.5% Indirect Expenses (67) (81) (76) (80) (80) (82) (83) (85) (81) (82) +2.6% +0.5% Restructuring & O ne-time Costs (23) (2) (24) (1) – – – – – – Depreciation & Amortization (78) (72) (75) (74) (75) (75) (56) (32) (32) (32) Operating Income $57 $98 $56 $92 $120 $138 $169 $205 $221 $230 +46.0% +13.9% Plus: D&A 78 72 75 74 75 75 56 32 32 32 Plus: Amort. of Cap. Cloud-Based SW(1) – 3 7 8 7 7 7 7 1 – Plus: SBC & Other Adjustments 25 16 42 26 21 22 23 24 25 25 Adjusted EBITDA $160 $188 $180 $201 $222 $242 $254 $268 $278 $287 +11.1% +5.2% % Margin 21.9% 23.4% 25.0% 25.5% 26.7% 27.6% 27.8% 28.2% 28.3% 28.3% Tax-deductible D&A $15 $13 $19 $18 $27 $27 $32 $32 $26 $25 % of Revenue 2.1% 1.6% 2.6% 2.3% 3.2% 3.1% 3.5% 3.3% 2.6% 2.5% Capex $14 $17 $14 $23 $21 $22 $23 $24 $25 $25 % of Revenue 1.9% 2.1% 1.9% 3.0% 2.5% 2.5% 2.5% 2.5% 2.5% 2.5%
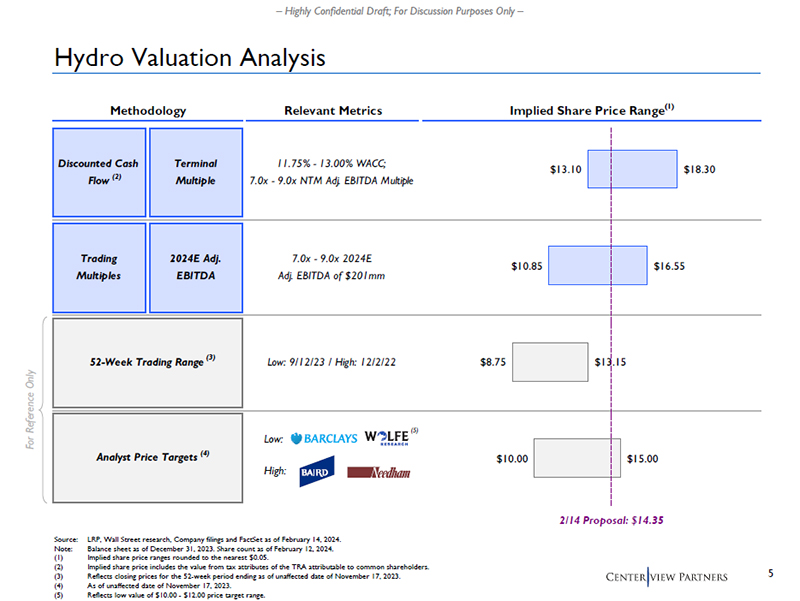
– Highly Confidential Draft; For Discussion Purposes Only – Methodology Relevant Metrics Implied Share Price Range(1) 52-Week Trading Range Low: 9/12/23 / High: 12/2/22 Analyst Price Targets Discounted Cash Flow Terminal Multiple 11.75% - 13.00% WACC; 7.0x - 9.0x NTM Adj. EBITDA Multiple Trading Multiples 2024E Adj. EBITDA 7.0x - 9.0x 2024E Adj. EBITDA of $201mm $10.00 $8.75 $10.85 $13.10 $15.00 $13.15 $16.55 $18.30 Hydro Valuation Analysis Source: LRP, Wall Street research, Company filings and FactSet as of February 14, 2024. Note: Balance sheet as of December 31, 2023. Share count as of February 12, 2024. (1) Implied share price ranges rounded to the nearest $0.05. (2) Implied share price includes the value from tax attributes of the TRA attributable to common shareholders. (3) Reflects closing prices for the 52-week period ending as of unaffected date of November 17, 2023. (4) As of unaffected date of November 17, 2023. (5) Reflects low value of $10.00 - $12.00 price target range. For Reference Only (4) (3) 2/14 Proposal: $14.35 Low: High: (5) (2)
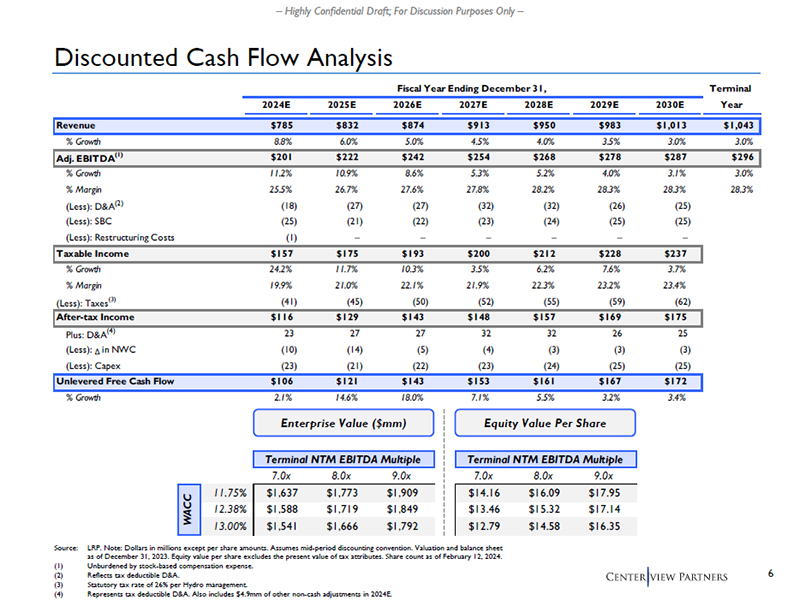
– Highly Confidential Draft; For Discussion Purposes Only – Discounted Cash Flow Analysis Source: LRP. Note: Dollars in millions except per share amounts. Assumes mid-period discounting convention. Valuation and balance sheet as of December 31, 2023. Equity value per share excludes the present value of tax attributes. Share count as of February 12, 2024. (1) Unburdened by stock-based compensation expense. (2) Reflects tax deductible D&A. (3) Statutory tax rate of 26% per Hydro management. (4) Represents tax deductible D&A. Also includes $4.9mm of other non-cash adjustments in 2024E. Fiscal Year Ending December 31, Terminal 2024E 2025E 2026E 2027E 2028E 2029E 2030E Year Revenue $785 $832 $874 $913 $950 $983 $1,013 $1,043 % Growth 8.8% 6.0% 5.0% 4.5% 4.0% 3.5% 3.0% 3.0% Adj. EBITDA(1) $201 $222 $242 $254 $268 $278 $287 $296 % Growth 11.2% 10.9% 8.6% 5.3% 5.2% 4.0% 3.1% 3.0% % Margin 25.5% 26.7% 27.6% 27.8% 28.2% 28.3% 28.3% 28.3% (Less): D&A(2) (18) (27) (27) (32) (32) (26) (25) (Less): SBC (25) (21) (22) (23) (24) (25) (25) (Less): Restructuring Costs (1) – – – – – – Taxable Income $157 $175 $193 $200 $212 $228 $237 % Growth 24.2% 11.7% 10.3% 3.5% 6.2% 7.6% 3.7% % Margin 19.9% 21.0% 22.1% 21.9% 22.3% 23.2% 23.4% (Less): Taxes(3) (41) (45) (50) (52) (55) (59) (62) After-tax Income $116 $129 $143 $148 $157 $169 $175 Plus: D&A(4) 23 27 27 32 32 26 25 (Less): Δ in NWC (10) (14) (5) (4) (3) (3) (3) (Less): Capex (23) (21) (22) (23) (24) (25) (25) Unlevered Free Cash Flow $106 $121 $143 $153 $161 $167 $172 % Growth 2.1% 14.6% 18.0% 7.1% 5.5% 3.2% 3.4% Enterprise Value ($mm) Equity Value Per Share Terminal NTM EBITDA Multiple Terminal NTM EBITDA Multiple 7.0x 8.0x 9.0x 7.0x 8.0x 9.0x 11.75% $1,637 $1,773 $1,909 $14.16 $16.09 $17.95 12.38% $1,588 $1,719 $1,849 $13.46 $15.32 $17.14 13.00% $1,541 $1,666 $1,792 $12.79 $14.58 $16.35 WACC
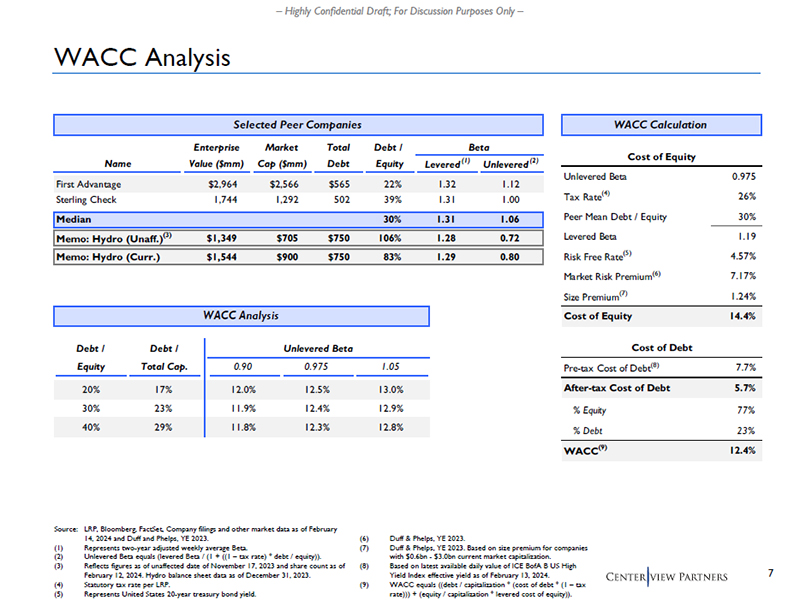
– Highly Confidential Draft; For Discussion Purposes Only – Selected Peer Companies Enterprise Market Total Debt / Beta Name Value ($mm) Cap ($mm) Debt Equity Levered (1) Unlevered (2) First Advantage $2,964 $2,566 $565 22% 1.32 1.12 Sterling Check 1,744 1,292 502 39% 1.31 1.00 Median 30% 1.31 1.06 Memo: Hydro (Unaff.)(3) $1,349 $705 $750 106% 1.28 0.72 Memo: Hydro (Curr.) $1,544 $900 $750 83% 1.29 0.80 WACC Analysis Source: LRP, Bloomberg, FactSet, Company filings and other market data as of February 14, 2024 and Duff and Phelps, YE 2023. (1) Represents two-year adjusted weekly average Beta. (2) Unlevered Beta equals (levered Beta / (1 + ((1 – tax rate) * debt / equity)). (3) Reflects figures as of unaffected date of November 17, 2023 and share count as of February 12, 2024. Hydro balance sheet data as of December 31, 2023. (4) Statutory tax rate per LRP. (5) Represents United States 20-year treasury bond yield. (6) Duff & Phelps, YE 2023. (7) Duff & Phelps, YE 2023. Based on size premium for companies with $0.6bn - $3.0bn current market capitalization. (8) Based on latest available daily value of ICE BofA B US High Yield Index effective yield as of February 13, 2024. (9) WACC equals ((debt / capitalization * (cost of debt * (1 – tax rate))) + (equity / capitalization * levered cost of equity)). WACC Calculation Cost of Equity Unlevered Beta 0.975 Tax Rate(4) 26% Peer Mean Debt / Equity 30% Levered Beta 1.19 Risk Free Rate(5) 4.57% Market Risk Premium(6) 7.17% Size Premium(7) 1.24% Cost of Equity 14.4% Cost of Debt Pre-tax Cost of Debt(8) 7.7% After-tax Cost of Debt 5.7% % Equity 77% % Debt 23% WACC(9) 12.4% WACC Analysis Debt / Debt / Unlevered Beta Equity Total Cap. 0.90 0.975 1.05 20% 17% 12.0% 12.5% 13.0% 30% 23% 11.9% 12.4% 12.9% 40% 29% 11.8% 12.3% 12.8%
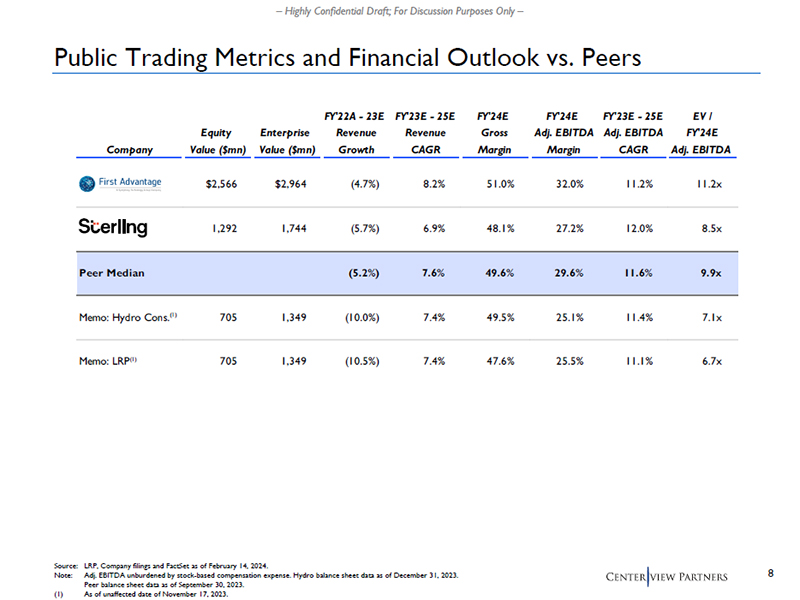
– Highly Confidential Draft; For Discussion Purposes Only – FY'22A - 23E FY'23E - 25E FY'24E FY'24E FY'23E - 25E EV / Equity Enterprise Revenue Revenue Gross Adj. EBITDA Adj. EBITDA FY'24E Company Value ($mn) Value ($mn) Growth CAGR Margin Margin CAGR Adj. EBITDA $2,566 $2,964 (4.7%) 8.2% 51.0% 32.0% 11.2% 11.2x 1,292 1,744 (5.7%) 6.9% 48.1% 27.2% 12.0% 8.5x Peer Median (5.2%) 7.6% 49.6% 29.6% 11.6% 9.9x Memo: Hydro Cons.(1) 705 1,349 (10.0%) 7.4% 49.5% 25.1% 11.4% 7.1x Memo: LRP(1) 705 1,349 (10.5%) 7.4% 47.6% 25.5% 11.1% 6.7x Public Trading Metrics and Financial Outlook vs. Peers Source: LRP, Company filings and FactSet as of February 14, 2024. Note: Adj. EBITDA unburdened by stock-based compensation expense. Hydro balance sheet data as of December 31, 2023. Peer balance sheet data as of September 30, 2023. (1) As of unaffected date of November 17, 2023.
– Highly Confidential Draft; For Discussion Purposes Only – Appendix Supporting Materials
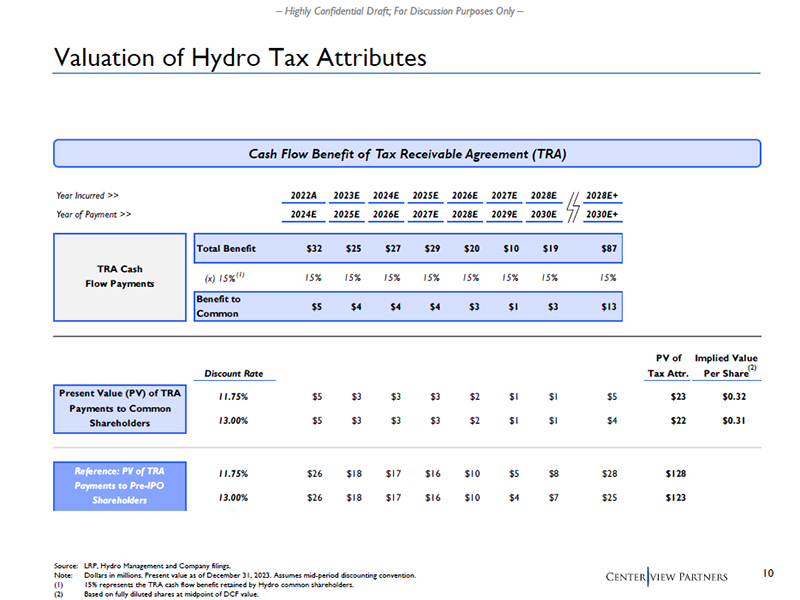
– Highly Confidential Draft; For Discussion Purposes Only – Valuation of Hydro Tax Attributes Cash Flow Benefit of Tax Receivable Agreement (TRA) Source: LRP, Hydro Management and Company filings. Note: Dollars in millions. Present value as of December 31, 2023. Assumes mid-period discounting convention. (1) 15% represents the TRA cash flow benefit retained by Hydro common shareholders. (2) Based on fully diluted shares at midpoint of DCF value. Year Incurred >> 2022A 2023E 2024E 2025E 2026E 2027E 2028E 2028E+ Year of Payment >> 2024E 2025E 2026E 2027E 2028E 2029E 2030E 2030E+ Total Benefit $32 $25 $27 $29 $20 $10 $19 $87 (x) 15%(1) 15% 15% 15% 15% 15% 15% 15% 15% Benefit to Common $5 $4 $4 $4 $3 $1 $3 $13 PV of Implied Value Discount Rate Tax Attr. Per Share 11.75% $5 $3 $3 $3 $2 $1 $1 $5 $23 $0.32 13.00% $5 $3 $3 $3 $2 $1 $1 $4 $22 $0.31 11.75% $26 $18 $17 $16 $10 $5 $8 $28 $128 13.00% $26 $18 $17 $16 $10 $4 $7 $25 $123 TRA Cash Flow Payments Reference: PV of TRA Payments to Pre-IPO Shareholders Present Value (PV) of TRA Payments to Common Shareholders (2)
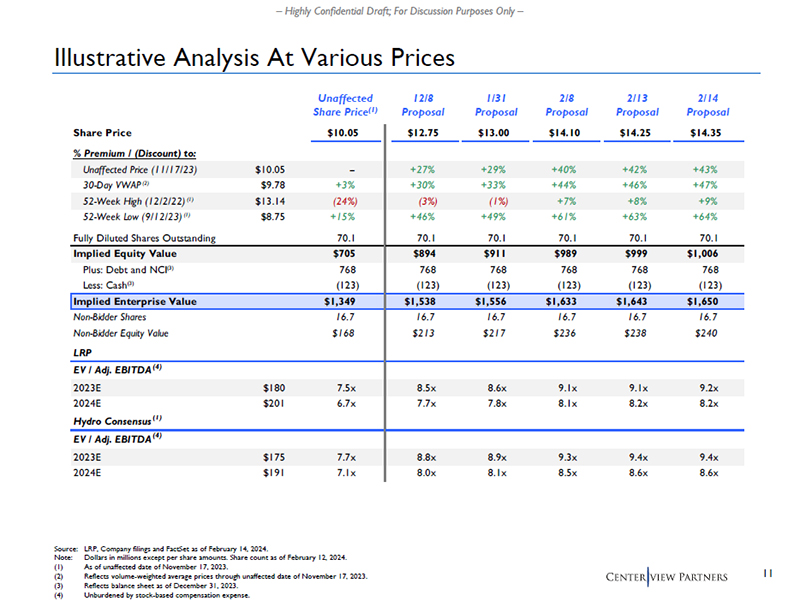
– Highly Confidential Draft; For Discussion Purposes Only – Illustrative Analysis At Various Prices Source: LRP, Company filings and FactSet as of February 14, 2024. Note: Dollars in millions except per share amounts. Share count as of February 12, 2024. (1) As of unaffected date of November 17, 2023. (2) Reflects volume-weighted average prices through unaffected date of November 17, 2023. (3) Reflects balance sheet as of December 31, 2023. (4) Unburdened by stock-based compensation expense. 12/8 Proposal Unaffected Share Price(1) 1/31 Proposal 2/8 Proposal 2/13 Proposal Share Price $10.05 $12.75 $13.00 $14.10 $14.25 $14.35 % Premium / (Discount) to: Unaffected Price (11/17/23) $10.05 -- +27% +29% +40% +42% +43% 30-Day VWAP (2) $9.78 +3% +30% +33% +44% +46% +47% 52-Week High (12/2/22) (1) $13.14 (24%) (3%) (1%) +7% +8% +9% 52-Week Low (9/12/23) (1) $8.75 +15% +46% +49% +61% +63% +64% Fully Diluted Shares Outstanding 70.1 70.1 70.1 70.1 70.1 70.1 Implied Equity Value $705 $894 $911 $989 $999 $1,006 Plus: Debt and NCI(3) 768 768 768 768 768 768 Less: Cash(3) (123) (123) (123) (123) (123) (123) Implied Enterprise Value $1,349 $1,538 $1,556 $1,633 $1,643 $1,650 Non-Bidder Shares 16.7 16.7 16.7 16.7 16.7 16.7 Non-Bidder Equity Value $168 $213 $217 $236 $238 $240 LRP EV / Adj. EBITDA(4) 2023E $180 7.5x 8.5x 8.6x 9.1x 9.1x 9.2x 2024E $201 6.7x 7.7x 7.8x 8.1x 8.2x 8.2x Hydro Consensus (1) EV / Adj. EBITDA(4) 2023E $175 7.7x 8.8x 8.9x 9.3x 9.4x 9.4x 2024E $191 7.1x 8.0x 8.1x 8.5x 8.6x 8.6x 2/14 Proposal
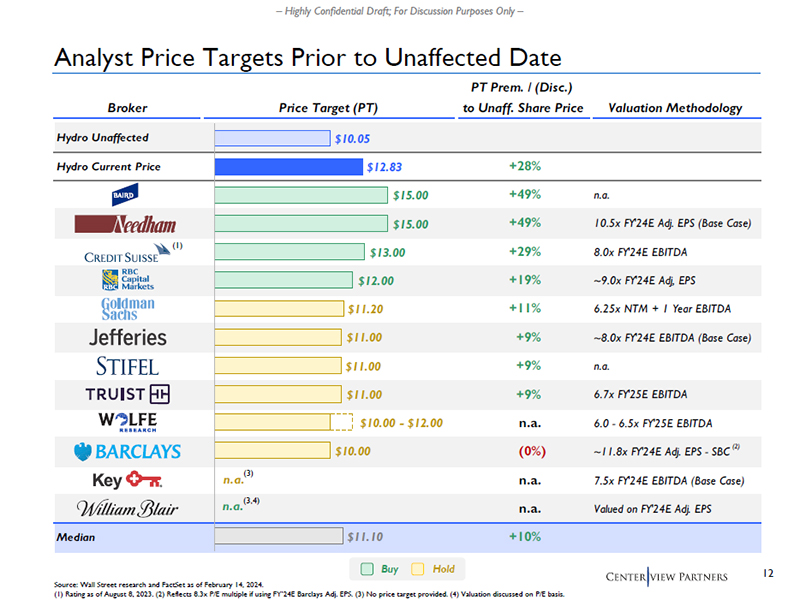
– Highly Confidential Draft; For Discussion Purposes Only – PT Prem. / (Disc.) Broker Price Target (PT) to Unaff. Share Price Valuation Methodology Hydro Unaffected Hydro Current Price +28% +49% n.a. +49% 10.5x FY'24E Adj. EPS (Base Case) +29% 8.0x FY'24E EBITDA +19% ~9.0x FY'24E Adj, EPS +11% 6.25x NTM + 1 Year EBITDA +9% ~8.0x FY'24E EBITDA (Base Case) +9% n.a. +9% 6.7x FY'25E EBITDA n.a. 6.0 - 6.5x FY'25E EBITDA (0%) ~11.8x FY'24E Adj. EPS - SBC n.a. 7.5x FY'24E EBITDA (Base Case) n.a. Valued on FY'24E Adj. EPS Median +10% $10.05 $12.83 $15.00 $15.00 $13.00 $12.00 $11.20 $11.00 $11.00 $11.00 $10.00 - $12.00 $10.00 n.a. n.a. $11.10 Analyst Price Targets Prior to Unaffected Date Source: Wall Street research and FactSet as of February 14, 2024. (1) Rating as of August 8, 2023. (2) Reflects 8.3x P/E multiple if using FY’24E Barclays Adj. EPS. (3) No price target provided. (4) Valuation discussed on P/E basis. Buy Hold (3) (3,4) (1) (2)
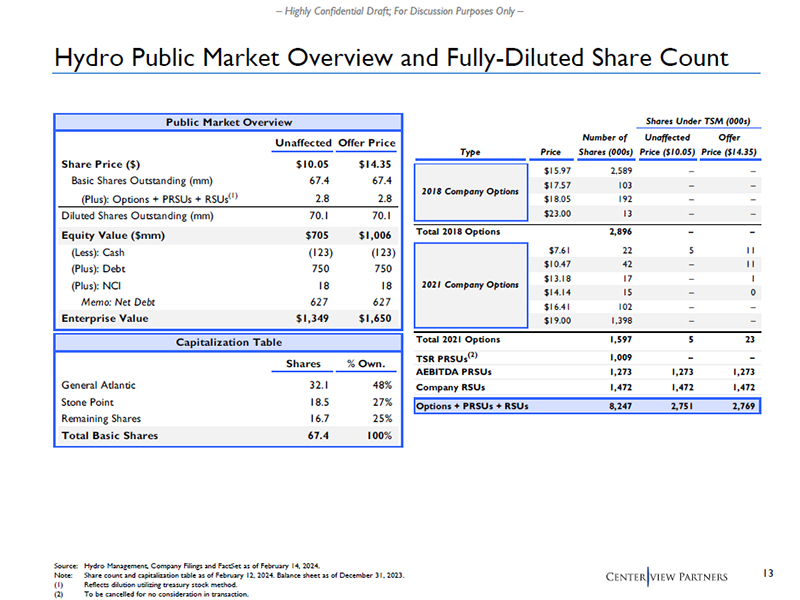
13 – Highly Confidential Draft; For Discussion Purposes Only – Shares Under TSM (000s) Number of Unaffected Offer Type Price Shares (000s) Price ($10.05) Price ($14.35) $15.97 2,589 – – $17.57 103 – – $18.05 192 – – $23.00 13 – – Total 2018 Options 2,896 – – $7.61 22 5 11 $10.47 42 – 11 $13.18 17 – 1 $14.14 15 – 0 $16.41 102 – – $19.00 1,398 – – Total 2021 Options 1,597 5 23 TSR PRSUs(2) 1,009 – – AEBITDA PRSUs 1,273 1,273 1,273 Company RSUs 1,472 1,472 1,472 Options + PRSUs + RSUs 8,247 2,751 2,769 2018 Company Options 2021 Company Options Capitalization Table Shares % Own. General Atlantic 32.1 48% Stone Point 18.5 27% Remaining Shares 16.7 25% Total Basic Shares 67.4 100% Hydro Public Market Overview and Fully-Diluted Share Count Source: Hydro Management, Company Filings and FactSet as of February 14, 2024. Note: Share count and capitalization table as of February 12, 2024. Balance sheet as of December 31, 2023. (1) Reflects dilution utilizing treasury stock method. (2) To be cancelled for no consideration in transaction. Public Market Overview Unaffected Offer Price Share Price ($) $10.05 $14.35 Basic Shares Outstanding (mm) 67.4 67.4 (Plus): Options + PRSUs + RSUs(1) 2.8 2.8 Diluted Shares Outstanding (mm) 70.1 70.1 Equity Value ($mm) $705 $1,006 (Less): Cash (123) (123) (Plus): Debt 750 750 (Plus): NCI 18 18 Memo: Net Debt 627 627 Enterprise Value $1,349 $1,650